Seattle and Austin coming October 1st.
The chart library
Claims go around; ledgers stay put. Each chart here started as a claim in
circulation and was rebuilt from the public record it should have been
checked against — city ledgers, state filings, federal statistics. Under
every one is the method: what was counted, from which dataset, with the
caveats stated. Nothing on this page requires a license to reproduce, and
every source line names its dataset well enough to rerun.
Counts and sources, never scored — and never a name.
2026-09-16
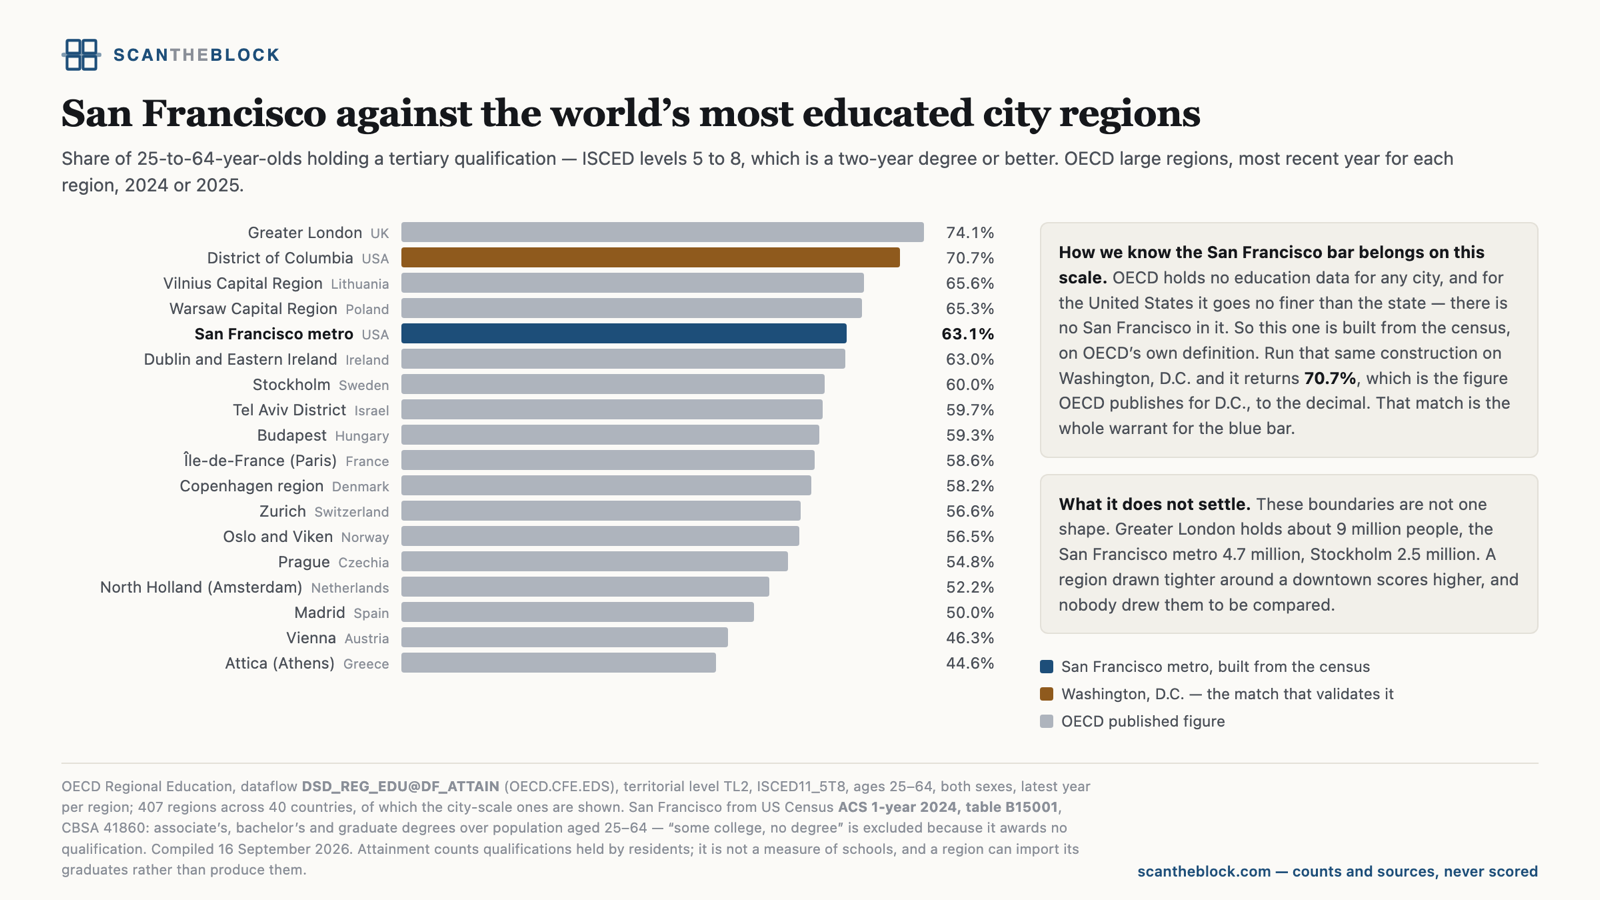
Share of 25-to-64-year-olds holding a tertiary qualification (ISCED 5–8, a two-year degree or better) across OECD large regions, with San Francisco placed on the same scale. Greater London leads at 74.1%, then Washington D.C. at 70.7%, Vilnius 65.6% and Warsaw 65.3%. San Francisco metro is 63.1% — fifth, and ahead of Dublin 63.0%, Stockholm 60.0%, Tel Aviv 59.7%, Paris 58.6%, Copenhagen 58.2%, Zurich 56.6%, Prague 54.8%, Amsterdam 52.2%, Madrid 50.0%, Vienna 46.3% and Athens 44.6%. The surprise is who is above it: two post-Soviet capitals, not the ones usually named.
Method. OECD Regional Education, dataflow DSD_REG_EDU@DF_ATTAIN (OECD.CFE.EDS), territorial level TL2, ISCED11_5T8, ages 25–64, both sexes, latest year per region — 407 regions across 40 countries, of which the city-scale ones are shown. OECD publishes no education data at city level anywhere, and for the United States it stops at the state, so there is no San Francisco in it; that bar is built from US Census ACS 1-year 2024 table B15001, CBSA 41860, as associate's plus bachelor's plus graduate degrees over population aged 25–64, with 'some college, no degree' excluded because it awards no qualification. The construction is checked by running it on Washington D.C., where it returns 70.7% — the figure OECD publishes for D.C., to the decimal. Boundaries are not one shape: Greater London is about 9 million people, the SF metro 4.7 million, Stockholm 2.5 million, and a region drawn tighter around a downtown scores higher. Attainment counts qualifications held by residents; it is not a measure of schools, and a region can import its graduates rather than produce them.
2026-09-16
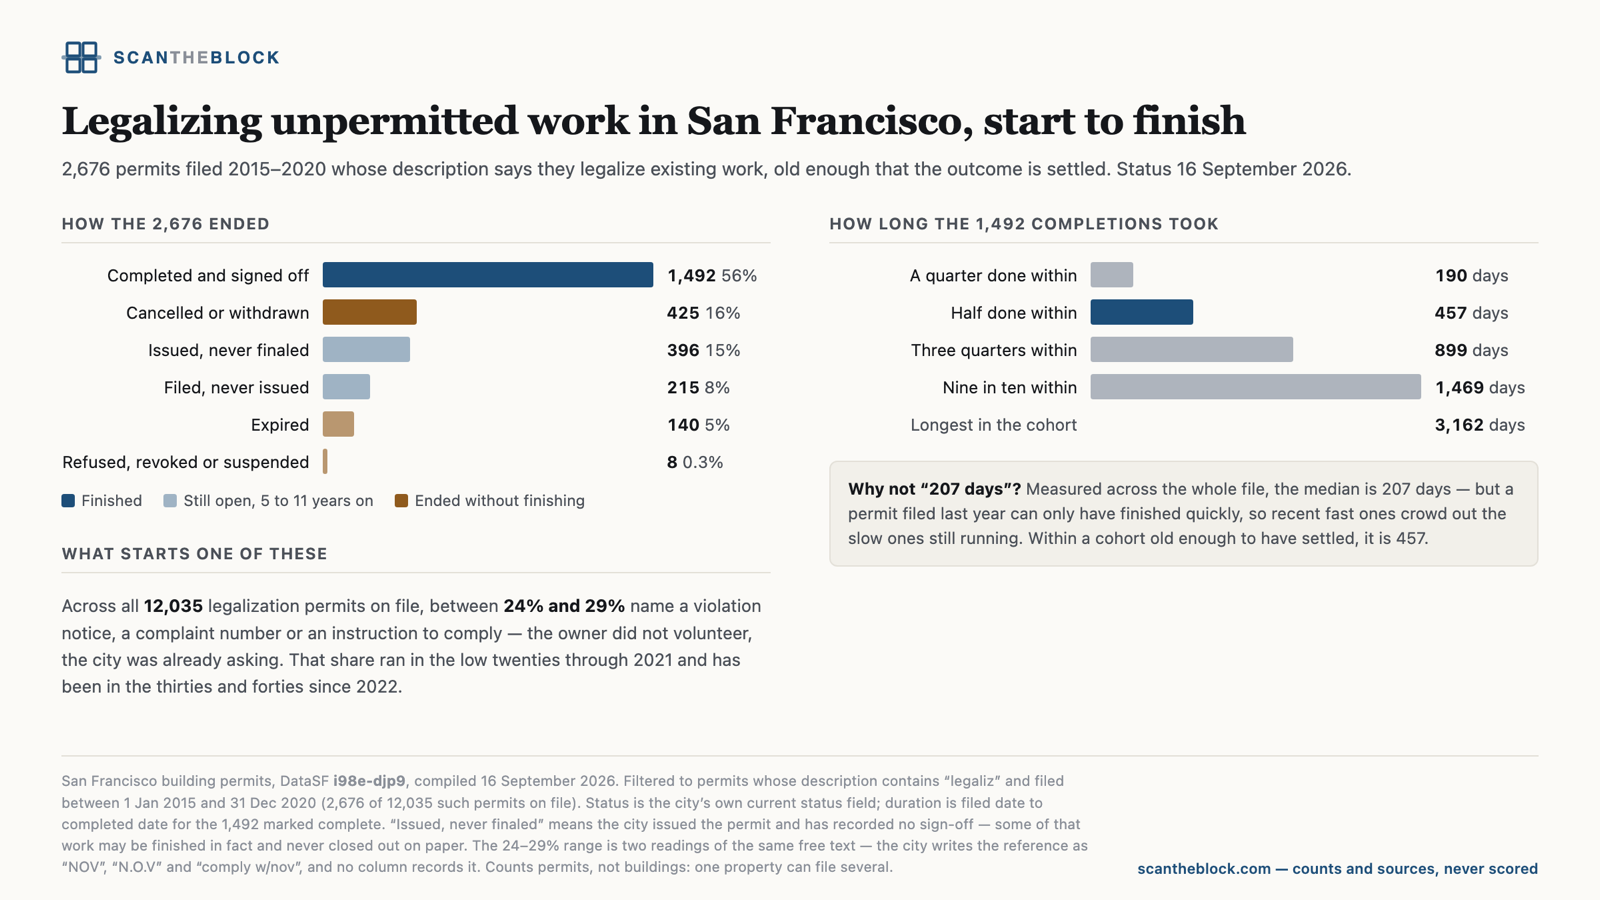
A viral thread about an SF owner who inherited an unpermitted basement, got a neighbor complaint and a notice of violation, and was told she could not convert it back to storage because that removes a housing unit. The countable part is the argument underneath it: whether legalizing existing work is a process people can finish. Of 2,676 permits filed 2015–2020 whose description says they legalize existing work, 1,492 (56%) completed and were signed off. 425 were cancelled or withdrawn, 140 expired, 8 refused or revoked; 396 sit issued with no sign-off recorded and 215 were never issued at all, five to eleven years on. Of the 1,492 that finished, half took more than 457 days, a quarter more than 899, and one in ten more than 1,469 — the longest ran 3,162 days. Across all 12,035 legalization permits on file, between 24% and 29% name a violation notice, a complaint number or an instruction to comply, a share that ran in the low twenties through 2021 and has been in the thirties and forties since 2022.
Method. DataSF building permits (i98e-djp9), compiled 16 September 2026. Filtered to permits whose description contains 'legaliz' and filed 1 Jan 2015 to 31 Dec 2020, which is 2,676 of the 12,035 such permits on file. The cohort is closed on purpose: measured across the whole file the median completion is 207 days, but a permit filed last year can only have finished quickly, so recent fast ones crowd out slow ones still running — right-censoring, and the reason the settled-cohort figure is 457. Status is the city's own current status field, so 'issued, never finaled' means the city recorded no sign-off; some of that work may be finished in fact and never closed out on paper. The 24–29% range is two readings of the same free text, because the city writes the reference as NOV, N.O.V and 'comply w/nov' and no column records it. Counts permits, not buildings: one property can file several. Says nothing about whether any particular refusal was right.
2026-09-02
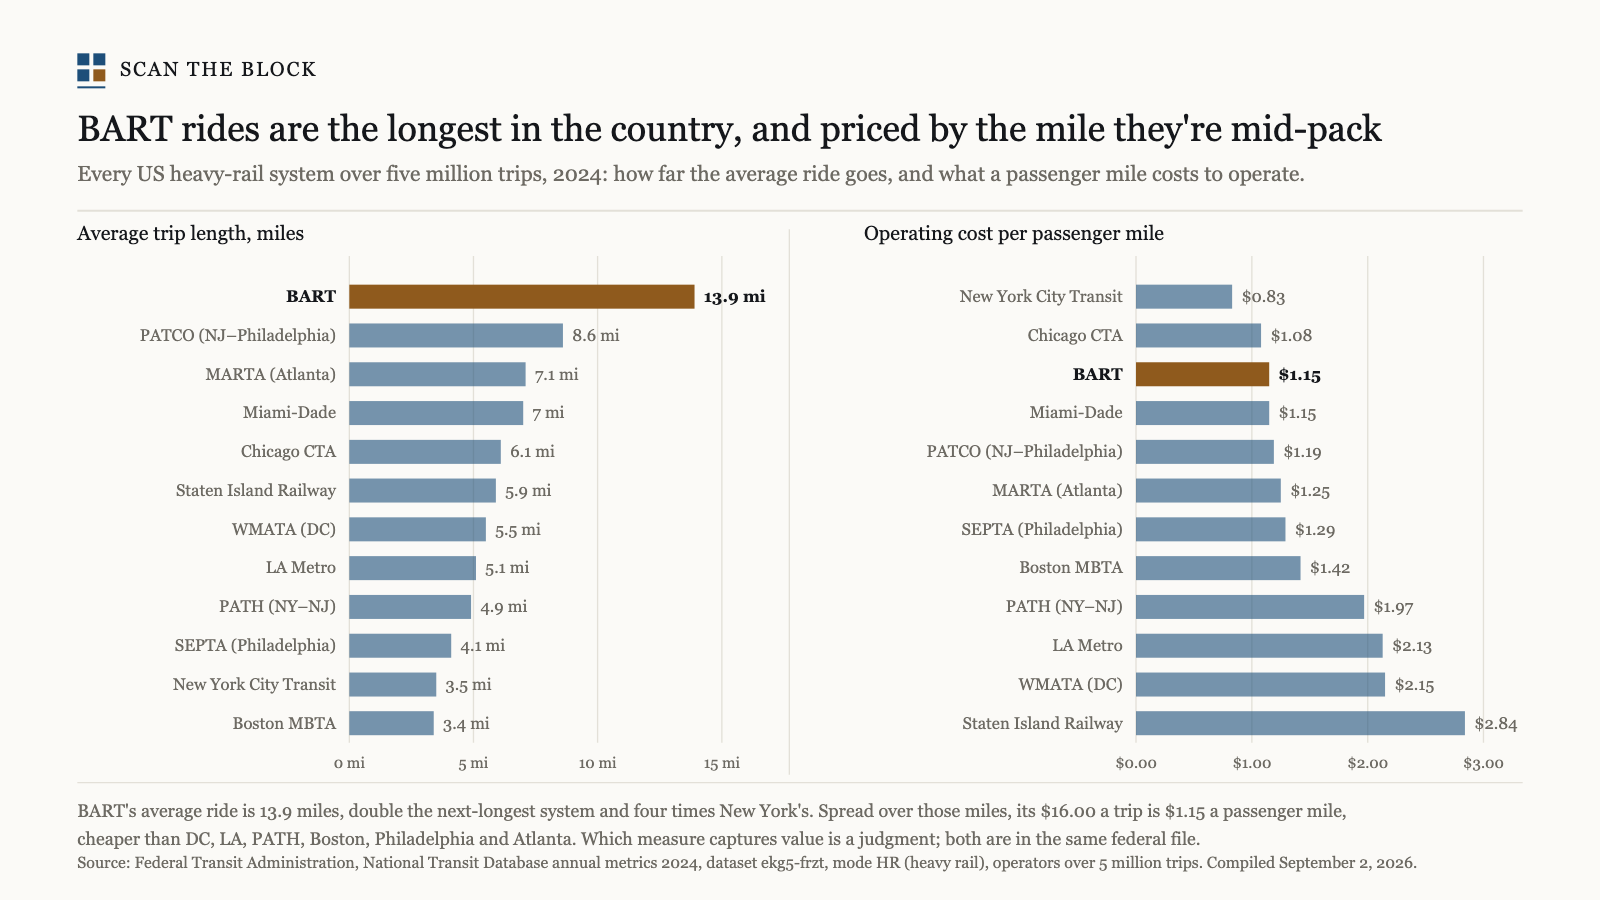
Every US heavy-rail system over five million trips, 2024. BART's average ride is 13.9 miles — double PATCO's 8.6, four times New York's 3.5. Spread over those miles, its $16.00 operating cost per trip becomes $1.15 per passenger mile: cheaper than Staten Island ($2.84), DC ($2.15), LA ($2.13), PATH ($1.97), Boston ($1.42), Philadelphia ($1.29) and Atlanta ($1.25); pricier than New York ($0.83) and Chicago ($1.08). Built to concede a reader's point in the cost-per-trip thread: BART itself argues cost per passenger mile is the better measure of what it delivers, and on that measure it is ordinary.
Method. FTA National Transit Database annual metrics (ekg5-frzt), report year 2024, mode HR, operators over 5M unlinked trips: passenger_miles ÷ unlinked_passenger_trips for trip length, total_operating_expenses ÷ passenger_miles for cost per passenger mile. Heavy rail only, so BART's eBART and airport connector, and every light-rail or commuter-rail peer, are excluded. Which measure captures value is a judgment; both are in the same file.
2026-09-02
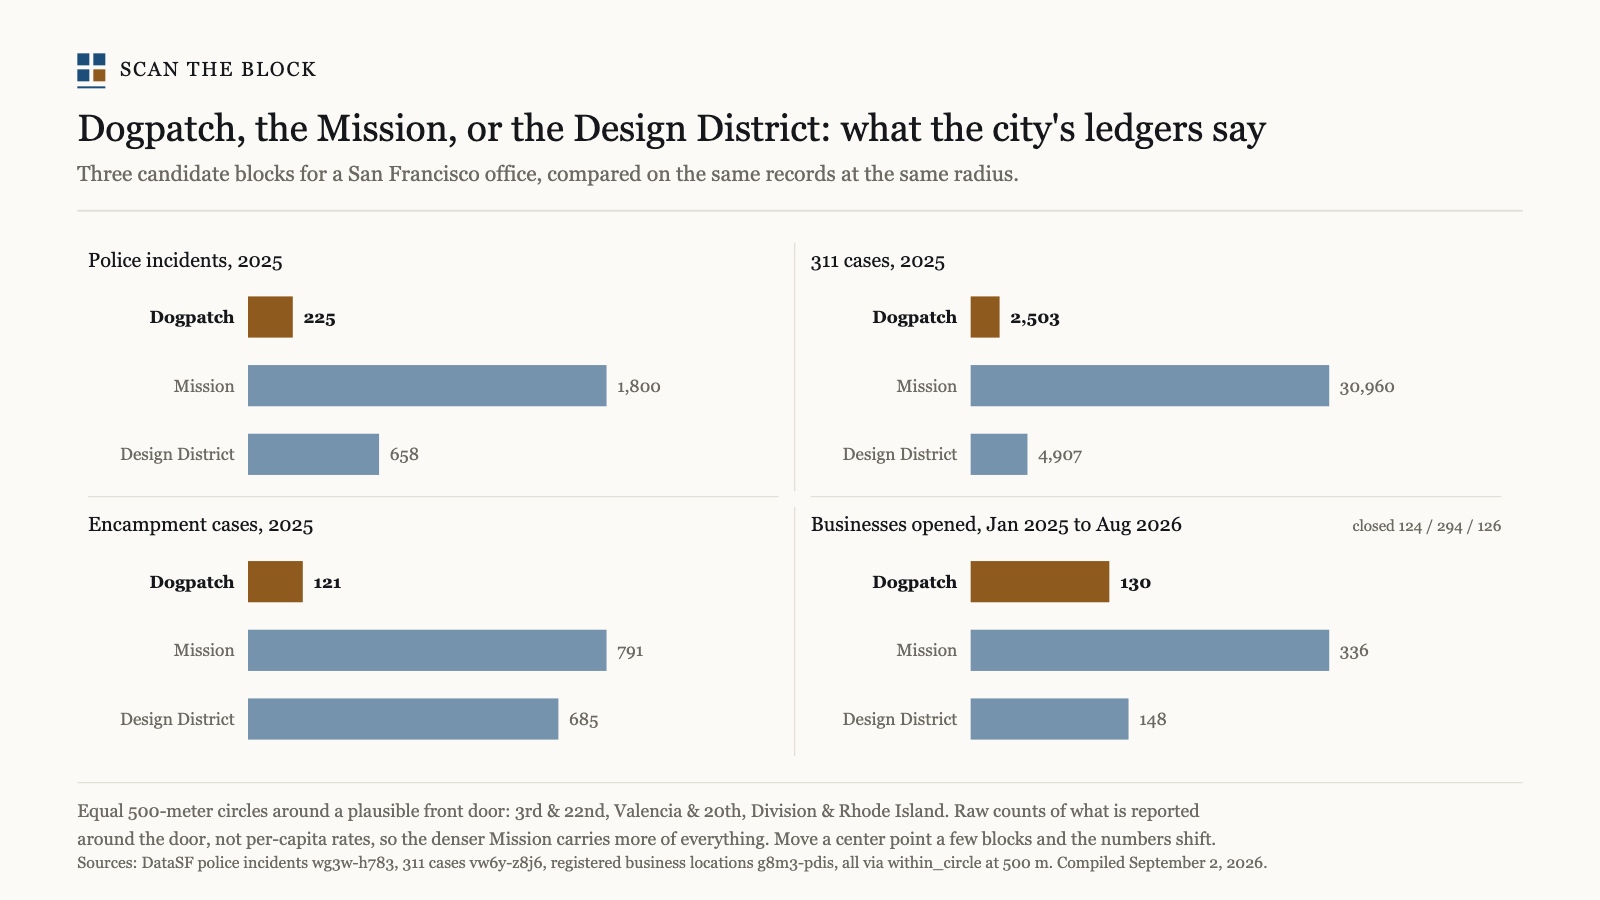
Someone asked where they'd open an SF office today: Dogpatch, the Mission, or the Potrero Design District. Equal 500-meter circles around a plausible front door in each, on the city's records. Police incidents 2025: Dogpatch 225, Mission 1,800, Design District 658. 311 cases 2025: 2,503 / 30,960 / 4,907, with encampment cases 121 / 791 / 685 — the Design District's 685 is 14% of everything reported there. Businesses opened Jan 2025–Aug 2026: 130 / 336 / 148 against 124 / 294 / 126 closed. Permits filed since 2025: 111 ($10M) / 616 ($23M) / 222 ($69M). On these, Dogpatch: an eighth of the Mission's incidents, a twelfth of its 311 volume, the fewest encampment reports, flat churn, and rail at the door.
Method. DataSF police incidents (wg3w-h783), 311 cases (vw6y-z8j6; encampment = service names containing 'ncampment'), registered business locations (g8m3-pdis), building permits (i98e-djp9), each queried with within_circle at 500 m around 3rd & 22nd, Valencia & 20th, and Division & Rhode Island. Raw counts of what is reported around the door, not per-capita rates, so the denser Mission carries more of everything; the three center points are our choice and moving one a few blocks changes the figures. Transit observations are not from a dataset.
2026-09-02
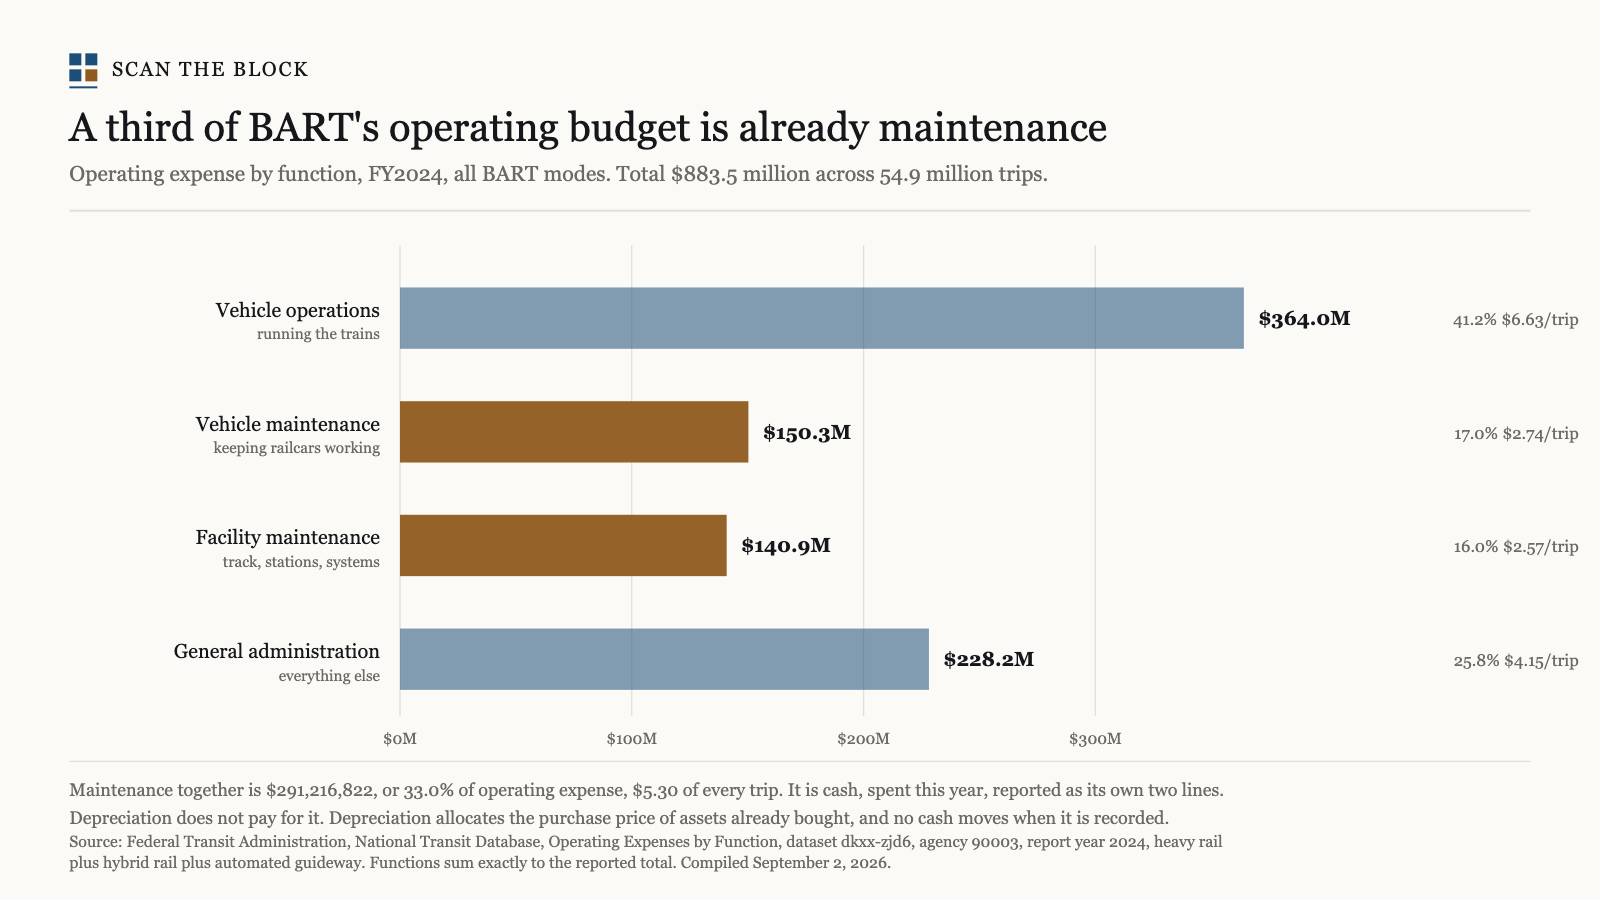
BART's FY2024 operating expense by function, all modes: vehicle operations $364.0M (41.2%), vehicle maintenance $150.3M (17.0%), facility maintenance $140.9M (16.0%), general administration $228.2M (25.8%). Maintenance together is $291.2M, a third of the $883.5M, $5.30 of every trip — cash spent this year and reported as its own lines. Built to answer the claim that depreciation 'accounts for future maintenance': it does not; depreciation allocates the purchase price of assets already bought, and no cash moves when it is recorded.
Method. FTA National Transit Database, Operating Expenses by Function (dkxx-zjd6), agency 90003, report year 2024, heavy rail + hybrid rail + automated guideway summed; functions sum exactly to the reported total. The by-function and metrics files differ by $555K (0.06%) on BART's FY24 total.
2026-09-02
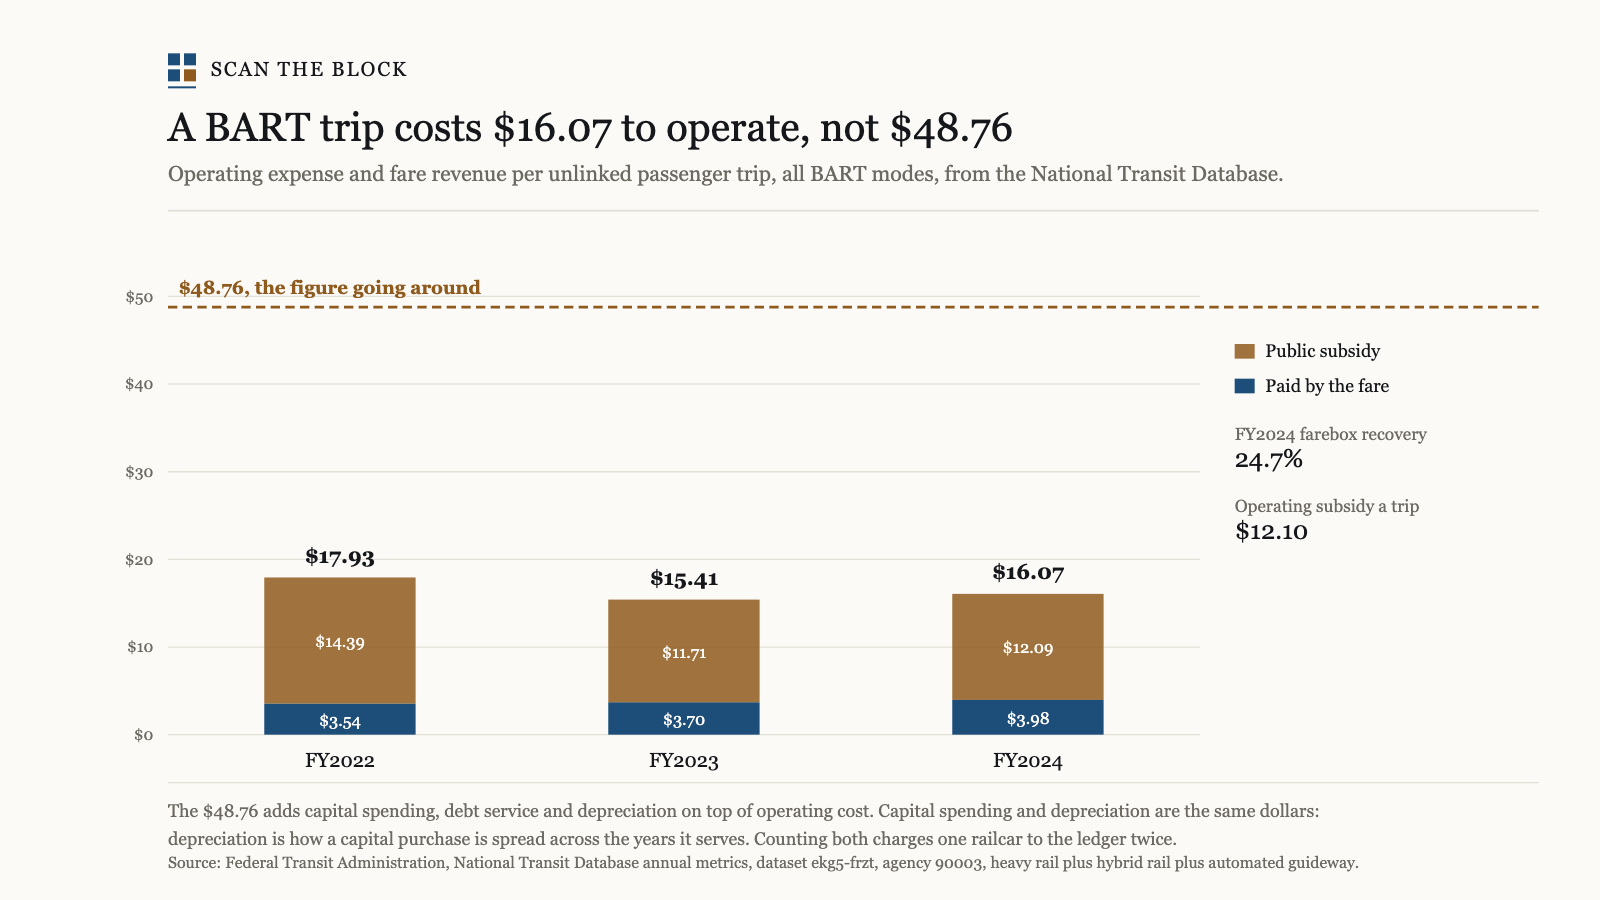
Operating expense and fare revenue per unlinked trip, FY2022–FY2024, all BART modes: $17.93, $15.41, $16.07 a trip, with fares covering $3.54, $3.70, $3.98. FY2024 farebox recovery 24.7%, operating subsidy $12.10 a trip. The $48.76 figure going around adds capital spending, debt service and depreciation on top of operating cost; capital spending and depreciation are the same dollars counted twice, and a 40-year railcar is charged entirely to one year's riders.
Method. FTA National Transit Database annual metrics (ekg5-frzt), agency 90003, HR + YR + MG summed per report year: total_operating_expenses ÷ unlinked_passenger_trips, fare_revenues_earned ÷ trips. A lifecycle cost that amortized capital honestly would land above $16.07 and nowhere near $48.76; NTD's current file covers FY22–FY24 only, so earlier years of the viral chart were not checked.
2026-09-02
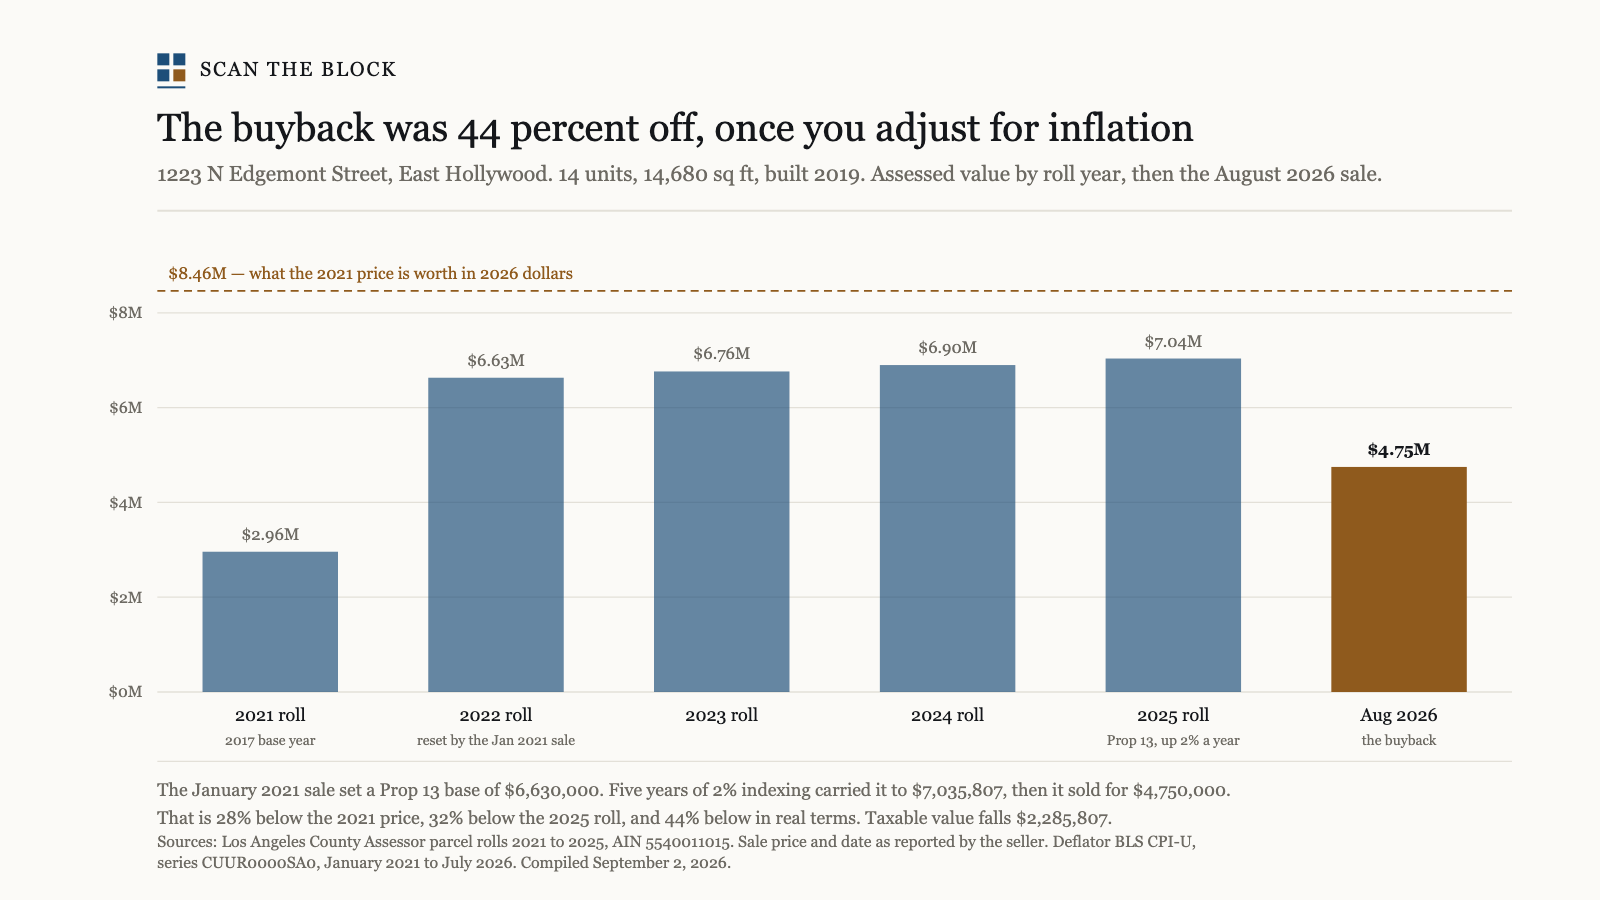
1223 N Edgemont Street, East Hollywood: 14 units, 14,680 sq ft, built 2019. The January 2021 sale set a Prop 13 base of $6,630,000 on the roll; 2% indexing carried it to $7,035,807 by 2025; the developer bought it back in August 2026 for $4,750,000. That is 28% below the 2021 price, 32% below the 2025 roll, and 44% below in real terms ($6.63M in Jan 2021 is $8.46M in July 2026 dollars). Taxable value falls $2,285,807.
Method. Los Angeles County Assessor parcel rolls 2021–2025 (ArcGIS Parcel_Data_2021_Table), AIN 5540011015, Roll_totLandImp by RollYear — the base-year reset on transfer independently prices the 2021 sale. 2026 sale price and date as reported by the seller. Deflator BLS CPI-U CUUR0000SA0, Jan 2021 → Jul 2026.
2026-09-02
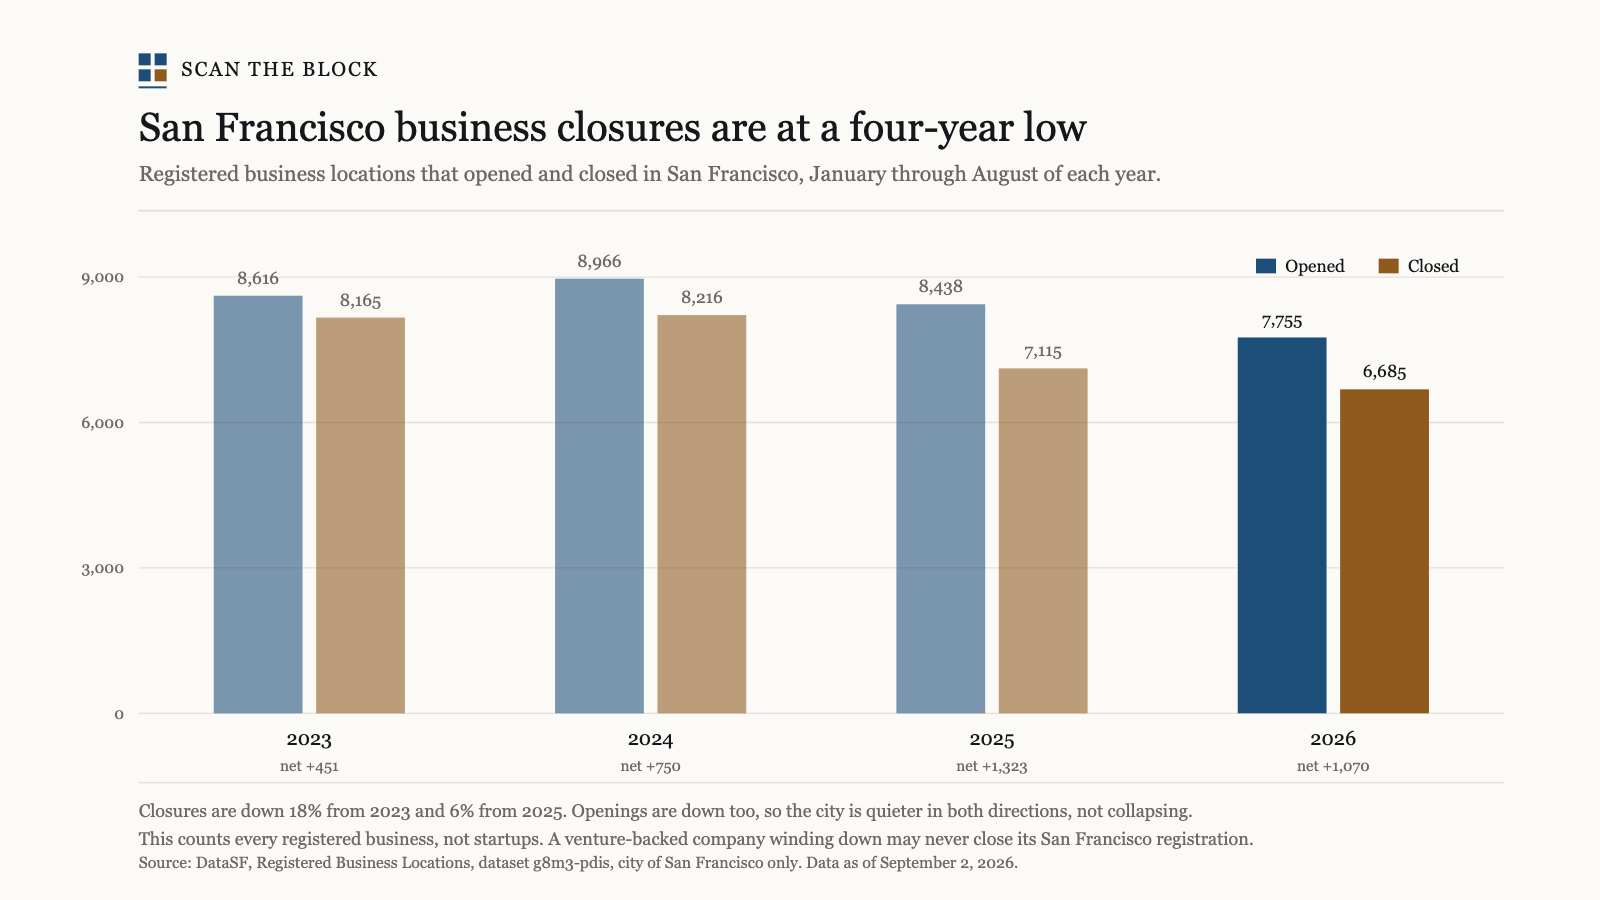
Registered business locations that opened and closed in San Francisco, January through August: 2023 8,616 opened / 8,165 closed; 2024 8,966 / 8,216; 2025 8,438 / 7,115; 2026 7,755 / 6,685. Closures are down 18% from 2023 and 6% from 2025; openings are down too. Built against the claim that startups are 'shutting down at record rate'.
Method. DataSF Registered Business Locations (g8m3-pdis), city of San Francisco, counts by location_start_date and location_end_date, data as of Sept 2, 2026. Counts every registered business, not startups: a venture-backed company winding down may never close its SF registration, and June carries an annual renewal spike every year.
2026-09-02
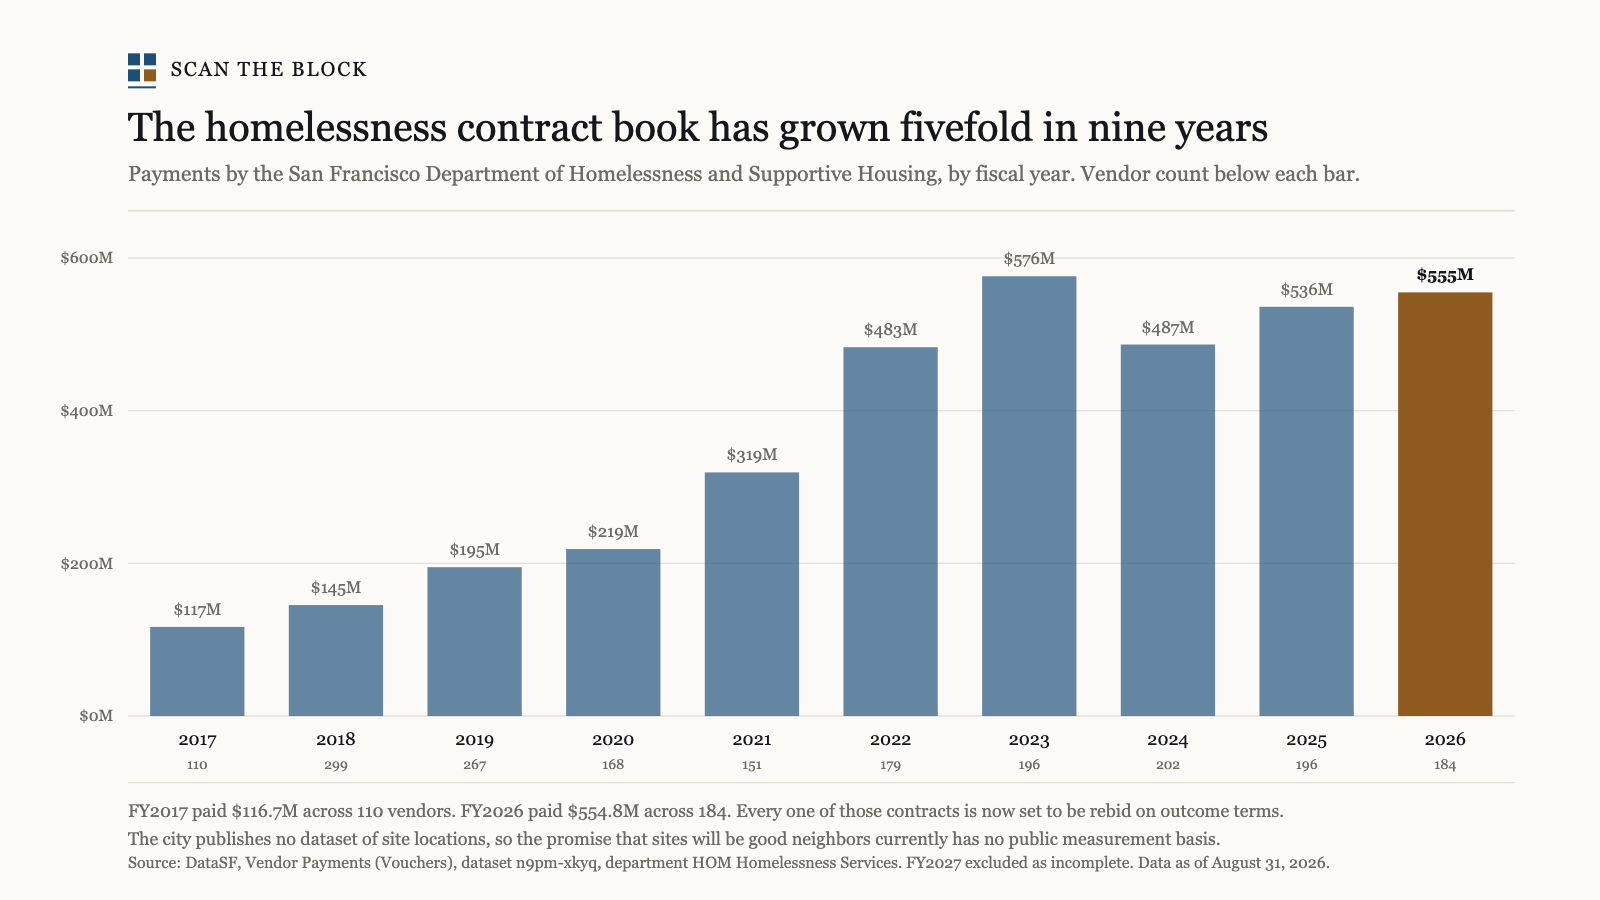
Payments by the SF Department of Homelessness and Supportive Housing by fiscal year: $116.7M across 110 vendors in FY2017 to $554.8M across 184 in FY2026, peaking at $576.0M in FY2023. Every one of those contracts is set to be rebid on outcome terms. The city publishes no dataset of site locations, so the promise that sites will be good neighbors has no public measurement basis yet.
Method. DataSF Vendor Payments (Vouchers) (n9pm-xkyq), department HOM Homelessness Services, sum of vouchers_paid and distinct vendors by fiscal_year; FY2027 excluded as two months old. Data as of Aug 31, 2026. Payments, not budgets.
2026-09-02
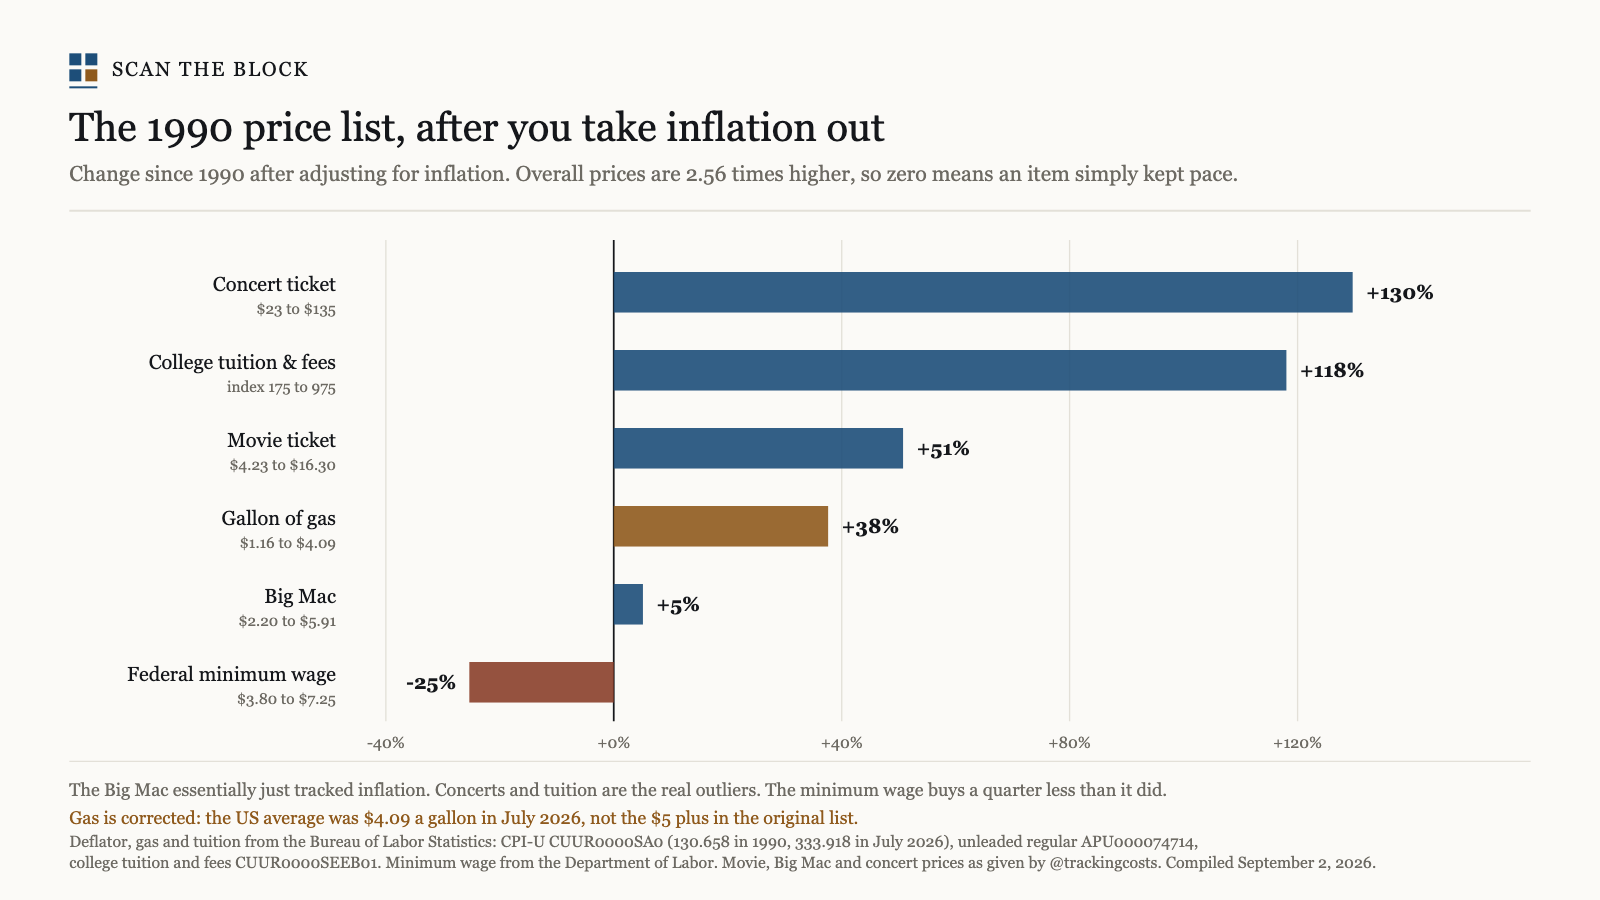
A viral list of 1990-vs-today prices, deflated: concert ticket +130%, college tuition and fees +118% (added the same day after a reader asked), movie ticket +51%, gallon of gas +38%, Big Mac +5%, federal minimum wage −25%. Overall prices are 2.56× higher, so zero means an item simply kept pace. The Big Mac tracked inflation; the concert is the outlier; the minimum wage buys a quarter less. Gas is corrected to the $4.09 July 2026 average, not the '$5+' in the original.
Method. Deflator BLS CPI-U CUUR0000SA0 (1990 average 130.658, July 2026 333.918); gas BLS APU000074714 (1990 $1.164, July 2026 $4.094); tuition BLS college tuition and fees index CUUR0000SEEB01 (175.0 → 975.2, +118% real); minimum wage from the Department of Labor ($3.80 April 1990, $7.25 since 2009). Movie, Big Mac and concert prices as given by the original post (Cinema United, Economist, Pollstar) and not independently pulled.
2026-09-02
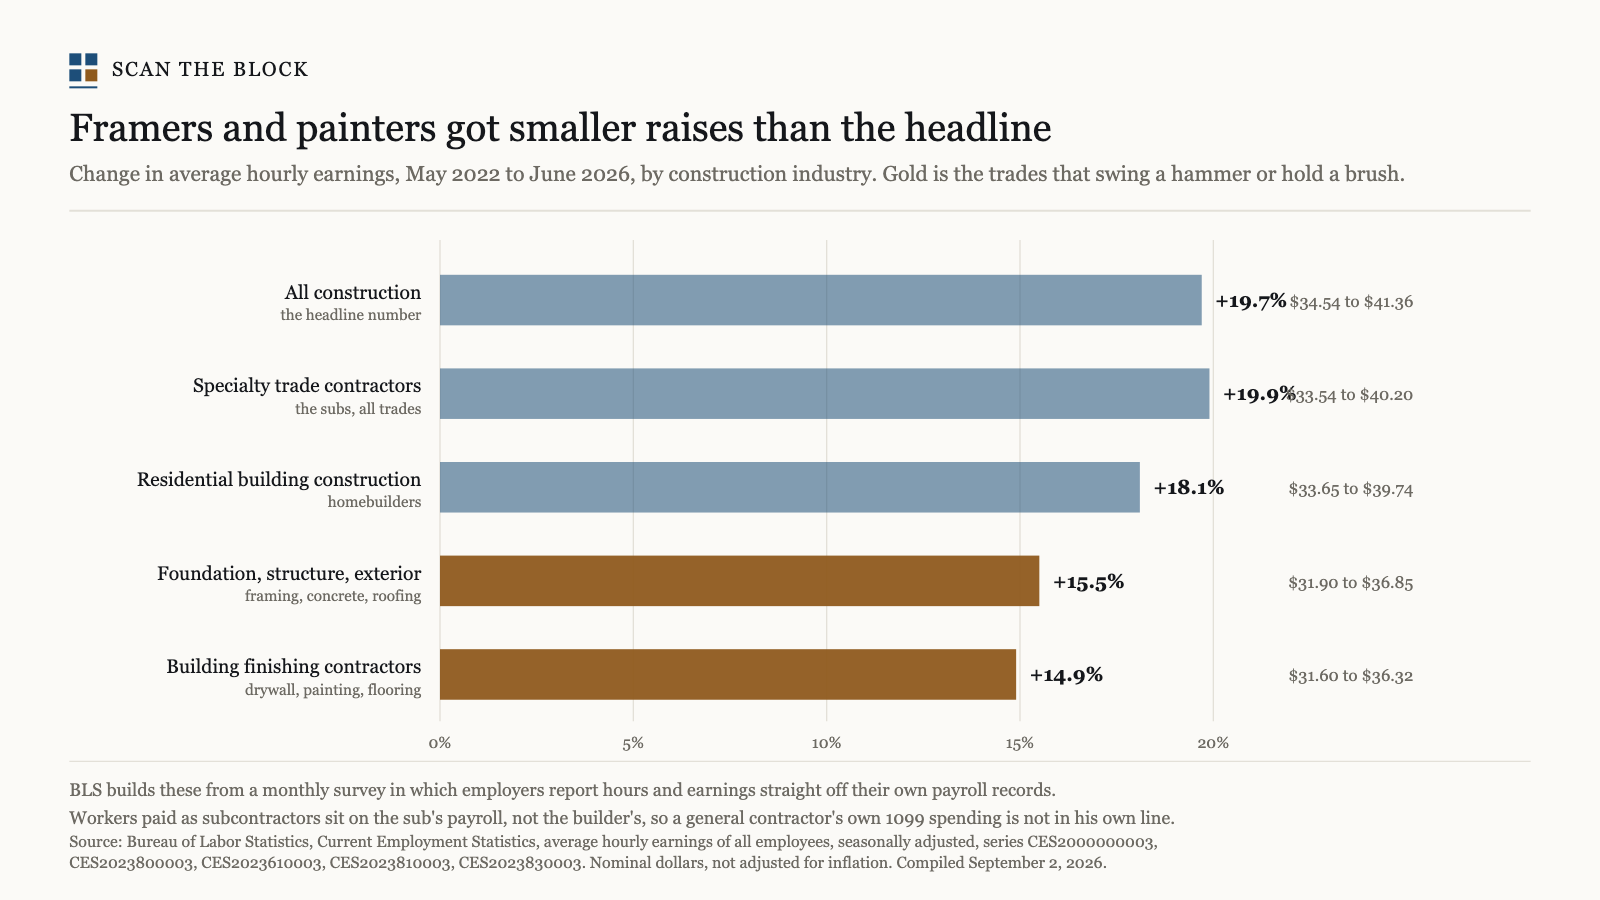
Average hourly earnings, May 2022 to June 2026: all construction +19.7% ($34.54→$41.36), specialty trade contractors +19.9%, residential building +18.1%, foundation/structure/exterior (framing, concrete, roofing) +15.5% ($31.90→$36.85), building finishing (drywall, painting, flooring) +14.9% ($31.60→$36.32). Built for a builder asking how BLS could know what he pays his framers: it surveys employers' payroll records; workers paid as subcontractors sit on the sub's payroll, not the builder's.
Method. BLS Current Employment Statistics, average hourly earnings of all employees, seasonally adjusted, series CES2000000003, CES2023800003, CES2023610003, CES2023810003, CES2023830003. Subsector series end a month earlier than the headline, so all are compared through June 2026. Nominal dollars.
2026-09-02
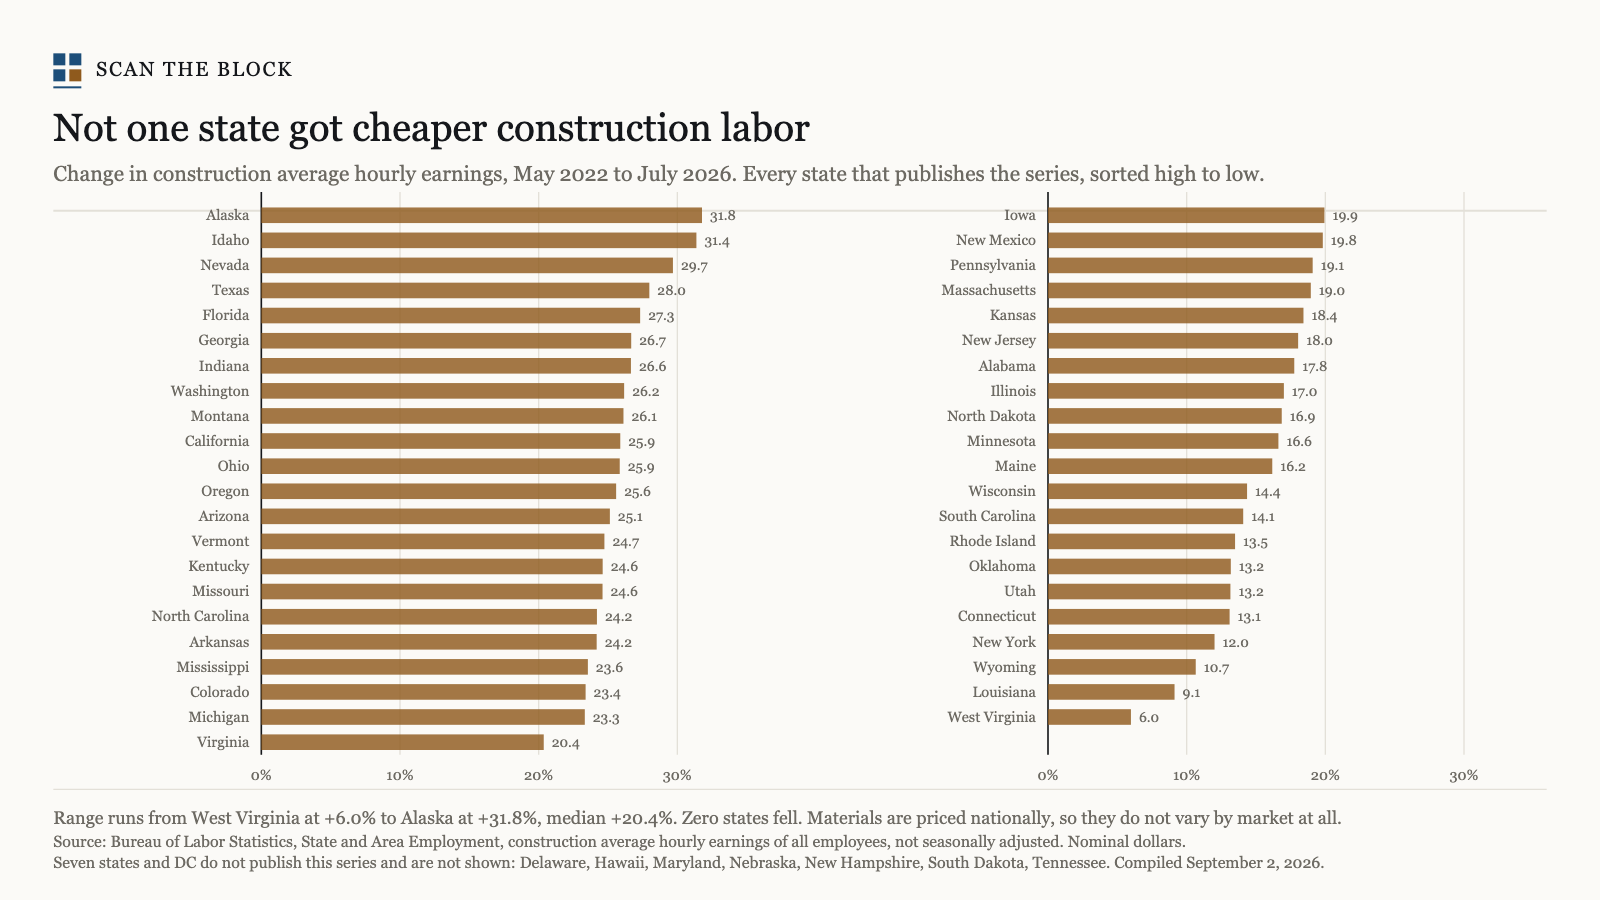
Change in construction average hourly earnings, May 2022 to July 2026, in every state that publishes the series: 43 states, all up, from West Virginia +6.0% to Alaska +31.8%, median +20.4%. Built to answer 'it's not a reality for many markets' after the national chart: the labor leg of the building slowdown holds in every market; materials are priced nationally and do not vary by market at all.
Method. BLS State and Area Employment, construction average hourly earnings of all employees, not seasonally adjusted, series SMU<fips>000002000000003. Delaware, Hawaii, Maryland, Nebraska, New Hampshire, South Dakota, Tennessee and DC do not publish it. Nominal dollars.
2026-09-02
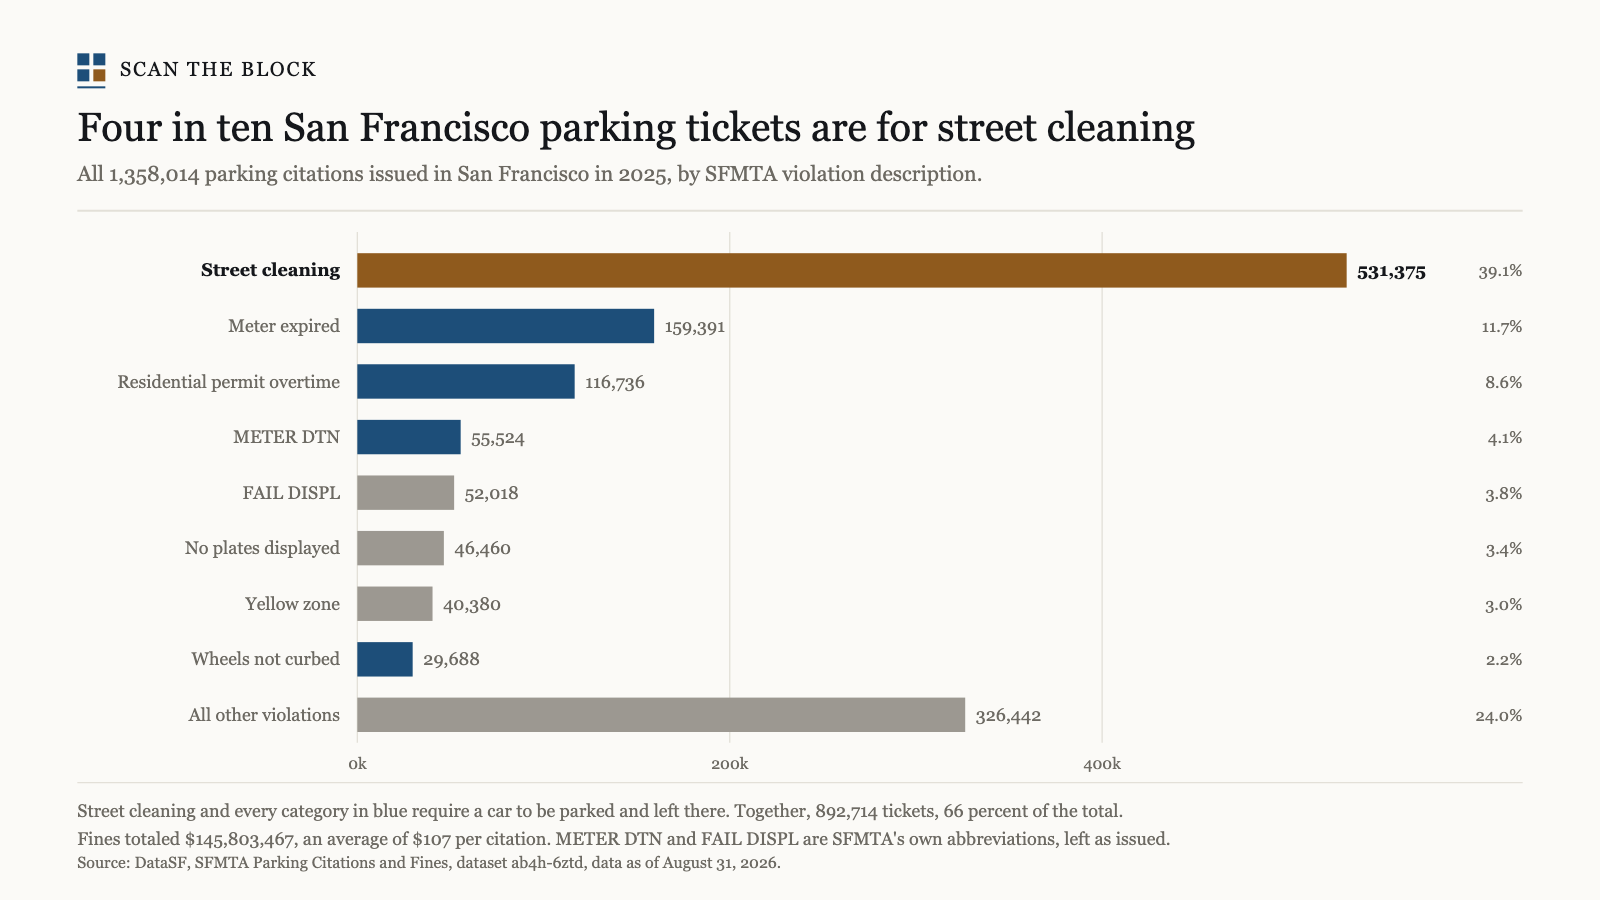
All 1,358,014 parking citations issued in San Francisco in 2025 by violation: street cleaning 531,375 (39.1%), meter expired 159,391, residential permit overtime 116,736, then smaller categories. Street cleaning plus the meter and permit categories require a car to be parked and left — 892,714 tickets, 66% of the total. Built to explain why a robotaxi fleet gets a tenth the tickets per mile: a parking ticket is a parking outcome, and the fleet does not park. Fines totaled $145.8M, $107 a citation.
Method. DataSF SFMTA Parking Citations and Fines (ab4h-6ztd), citation_issued_datetime in 2025, count by violation_desc; METER DTN and FAIL DISPL are SFMTA's own abbreviations, left as issued. Data as of Aug 31, 2026. No plates or individuals published; the dataset carries them.
2026-09-02
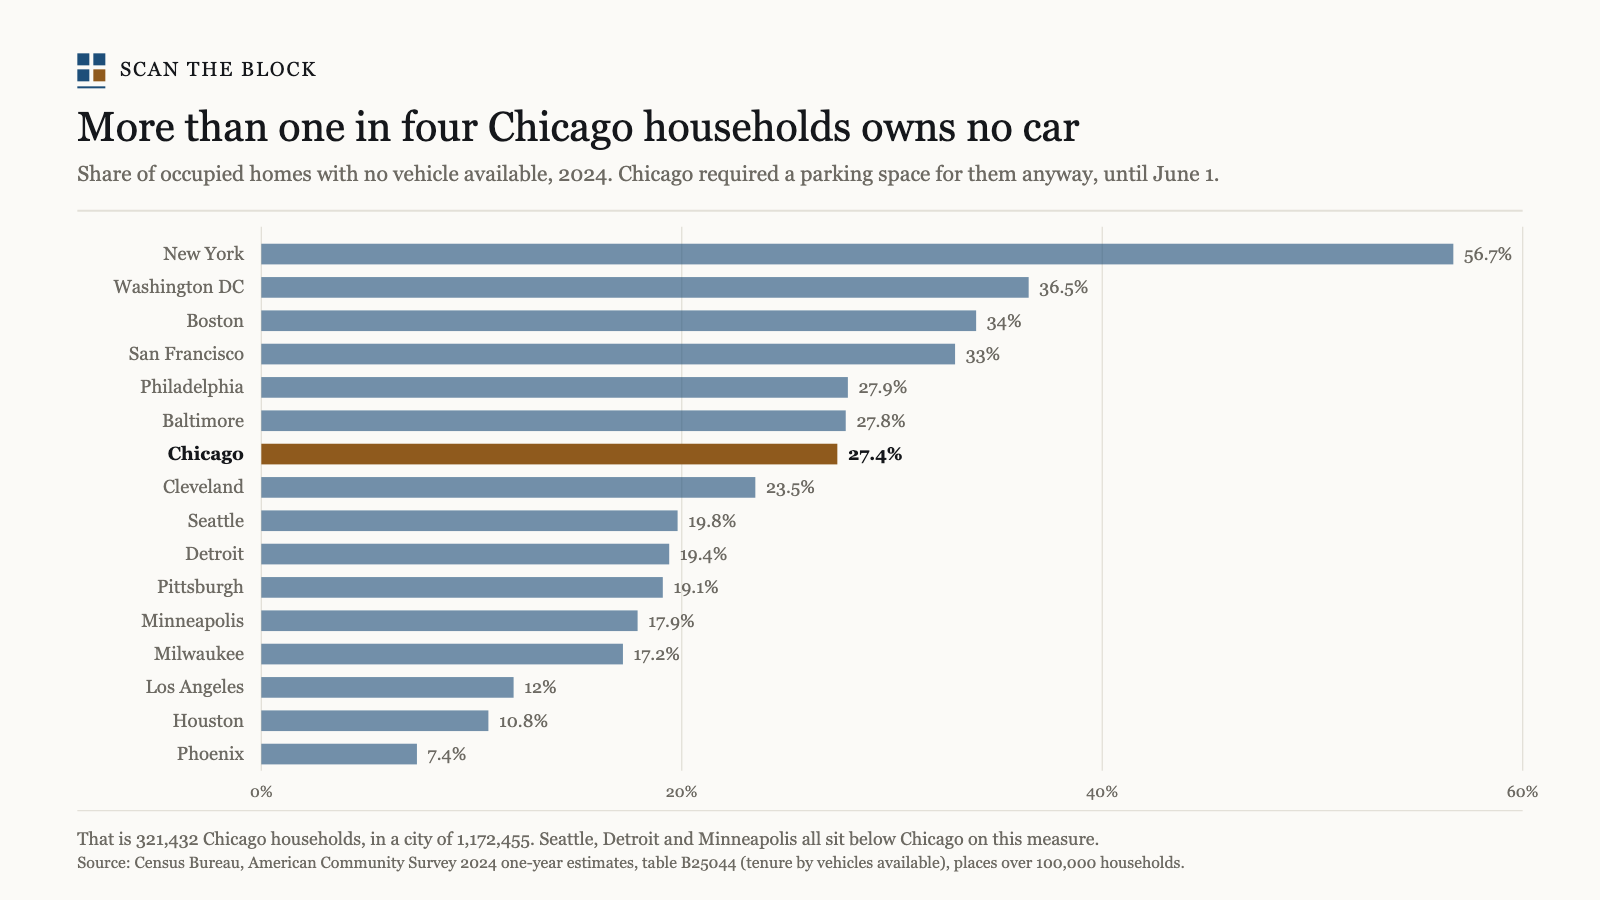
Share of occupied homes with no vehicle available, 2024, cities over 100,000 households: New York 56.7%, DC 36.5%, Boston 34.0%, San Francisco 33.0%, Philadelphia 27.9%, Baltimore 27.8%, Chicago 27.4% (321,432 of 1,172,455 households), Cleveland 23.5%, Seattle 19.8%, down to Phoenix 7.4%. Built for the Chicago parking-minimum thread: the city required a parking space for those households anyway, until June 1, 2026.
Method. Census ACS 2024 one-year estimates, table B25044 (tenure by vehicles available): owner-occupied with no vehicle (E003) plus renter-occupied with no vehicle (E010) over total occupied units (E001), from the table-based summary file.
2026-09-02
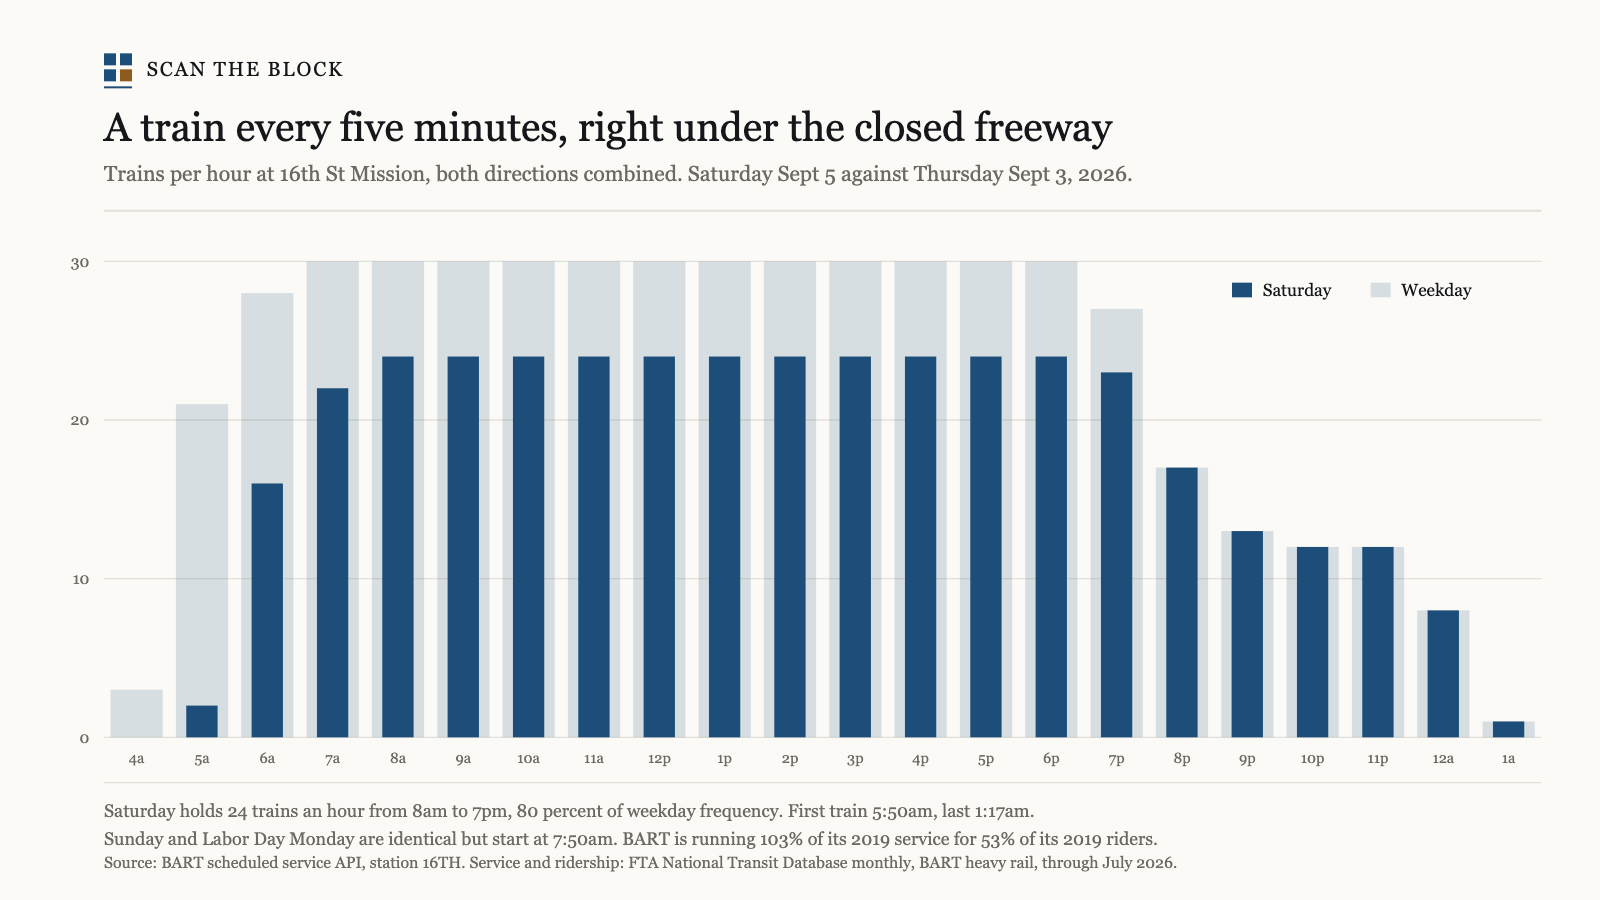
Trains per hour at 16th St Mission, both directions, for the Labor Day weekend NB 101 closure: Saturday holds 24 an hour from 8am to 7pm (about one every five minutes each way), 80% of weekday's 30; first train 5:50am, last 1:17am; Sunday and the holiday Monday identical but starting 7:50am. BART is running 103% of its 2019 service hours for 53% of its 2019 riders, so trains are about 40% emptier at the same frequency.
Method. BART schedule API (stnsched, station 16TH) for Sept 3, 5, 6 and 7, 2026, departures counted by hour. Service and ridership from FTA NTD monthly (8bui-9xvu), BART heavy rail, 2019 vs Jan–Jul 2026 annualized. On-time performance is not in an API and was not checked.
2026-08-30
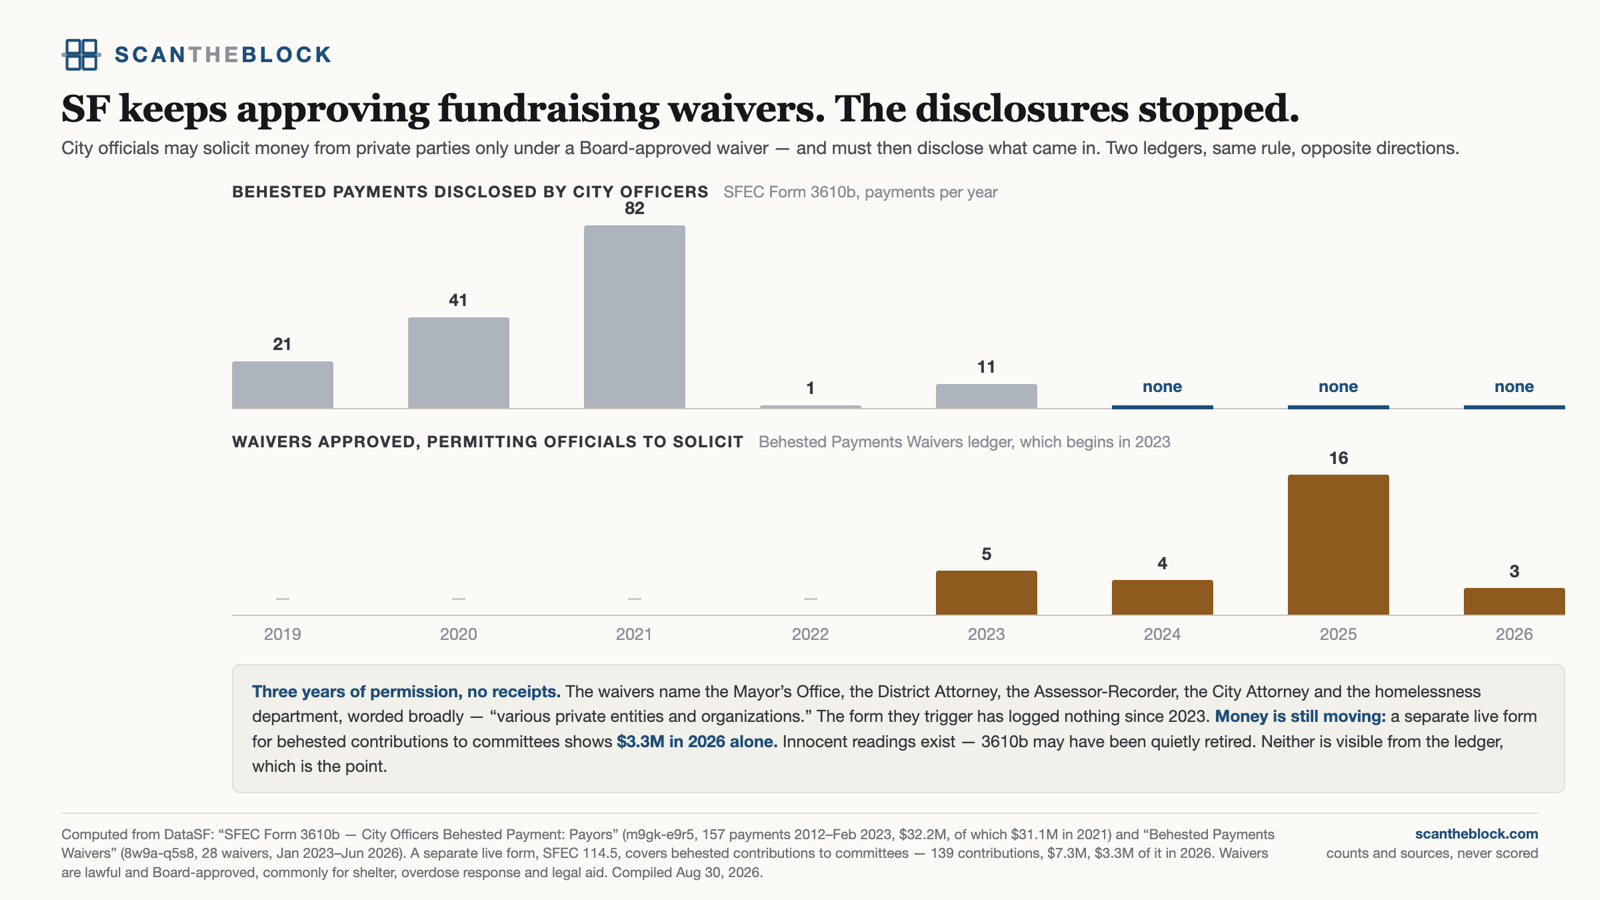
City officers may solicit money from private parties only under a Board-approved waiver, and must then disclose what came in. Waivers are accelerating — 5 in 2023, 4 in 2024, 16 in 2025, 3 so far in 2026, naming the Mayor's Office, the District Attorney, the Assessor-Recorder, the City Attorney and the homelessness department. The disclosure form those waivers trigger has recorded nothing since February 2023, though it worked before: 82 payments totaling $31.1M in 2021 alone. A separate live form shows $3.3M in behested contributions to committees in 2026.
Method. DataSF: SFEC Form 3610b — City Officers Behested Payment: Payors (m9gk-e9r5, 157 payments 2012–Feb 2023, $32.2M) and Behested Payments Waivers (8w9a-q5s8, 28 waivers Jan 2023–Jun 2026); SFEC Form 114.5 (mq45-f9zi) for the committee figure. Innocent readings exist — Form 3610b may have been retired, as its companion Form 3620 already has been, or nothing reportable was solicited. Neither is visible from the ledger. Waivers are lawful and Board-approved, commonly for shelter, overdose response and legal aid.
2026-08-30
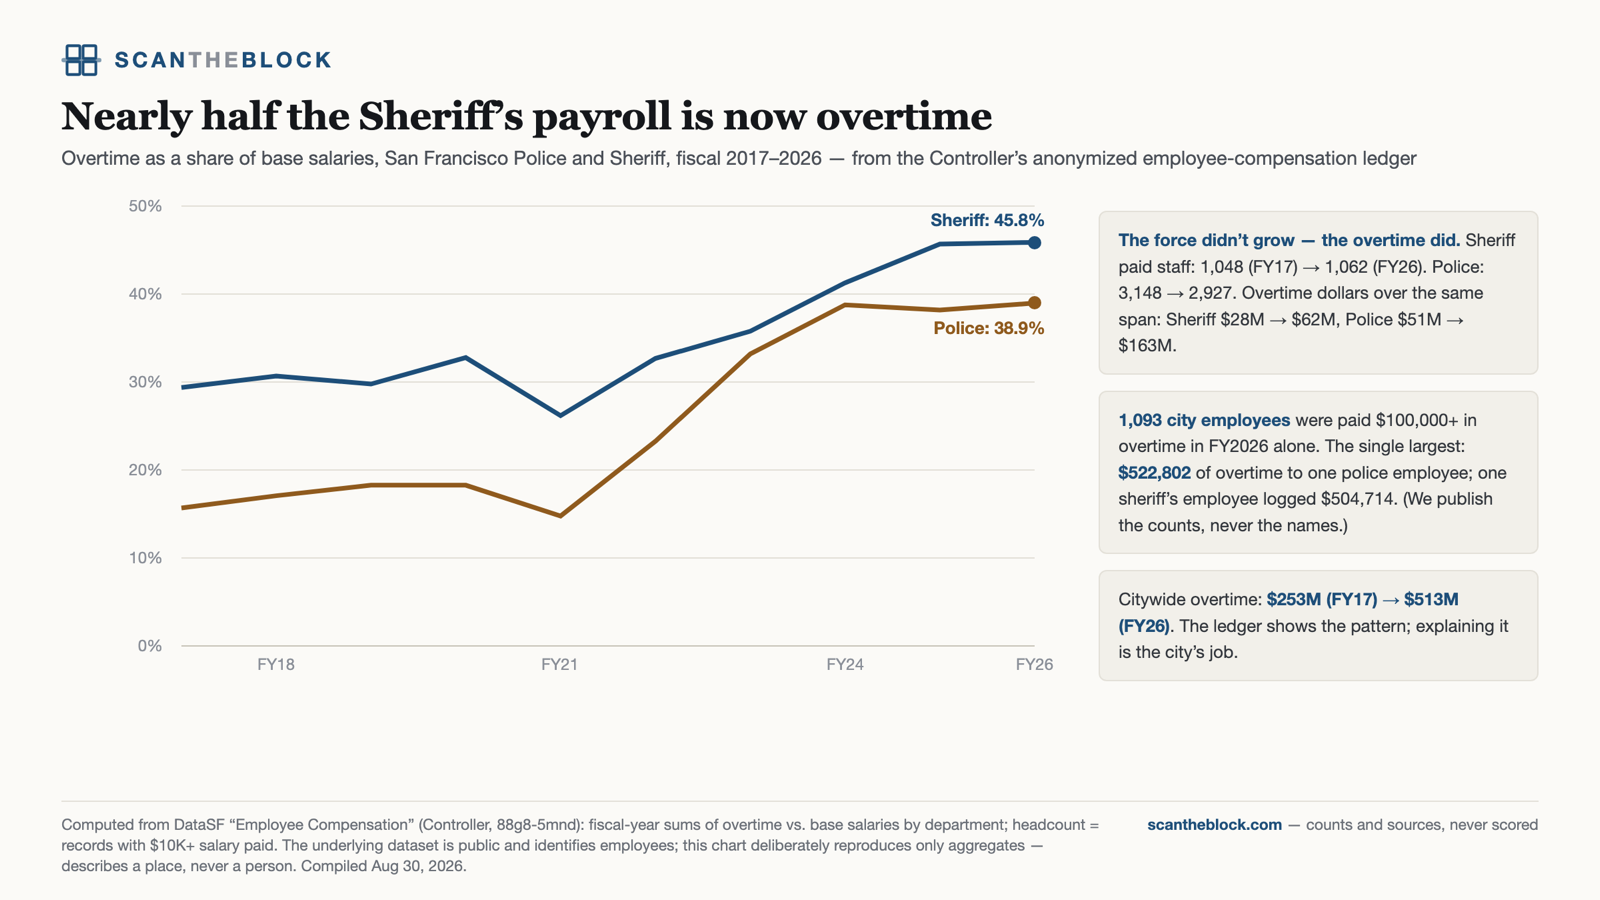
Overtime as a share of base salaries, 2017–2026. The Sheriff's Department reached 45.8% ($62.2M of OT on $136M of base) on a headcount that didn't grow; Police overtime tripled from $50.7M to $163.4M while paid headcount fell 7%. 1,093 city employees were paid $100,000 or more in overtime in FY2026, and 368 earned more in overtime than in base salary. Citywide overtime doubled from $253M to $513M.
Method. DataSF Employee Compensation (Controller, 88g8-5mnd): fiscal-year sums of overtime against base salaries by department; headcount approximated by records with $10K+ salary paid. Overtime has legitimate drivers — minimum-staffing rules, vacancy backfill, the voter-approved police staffing mandate. The underlying dataset identifies employees; this chart publishes only aggregates.
2026-08-30
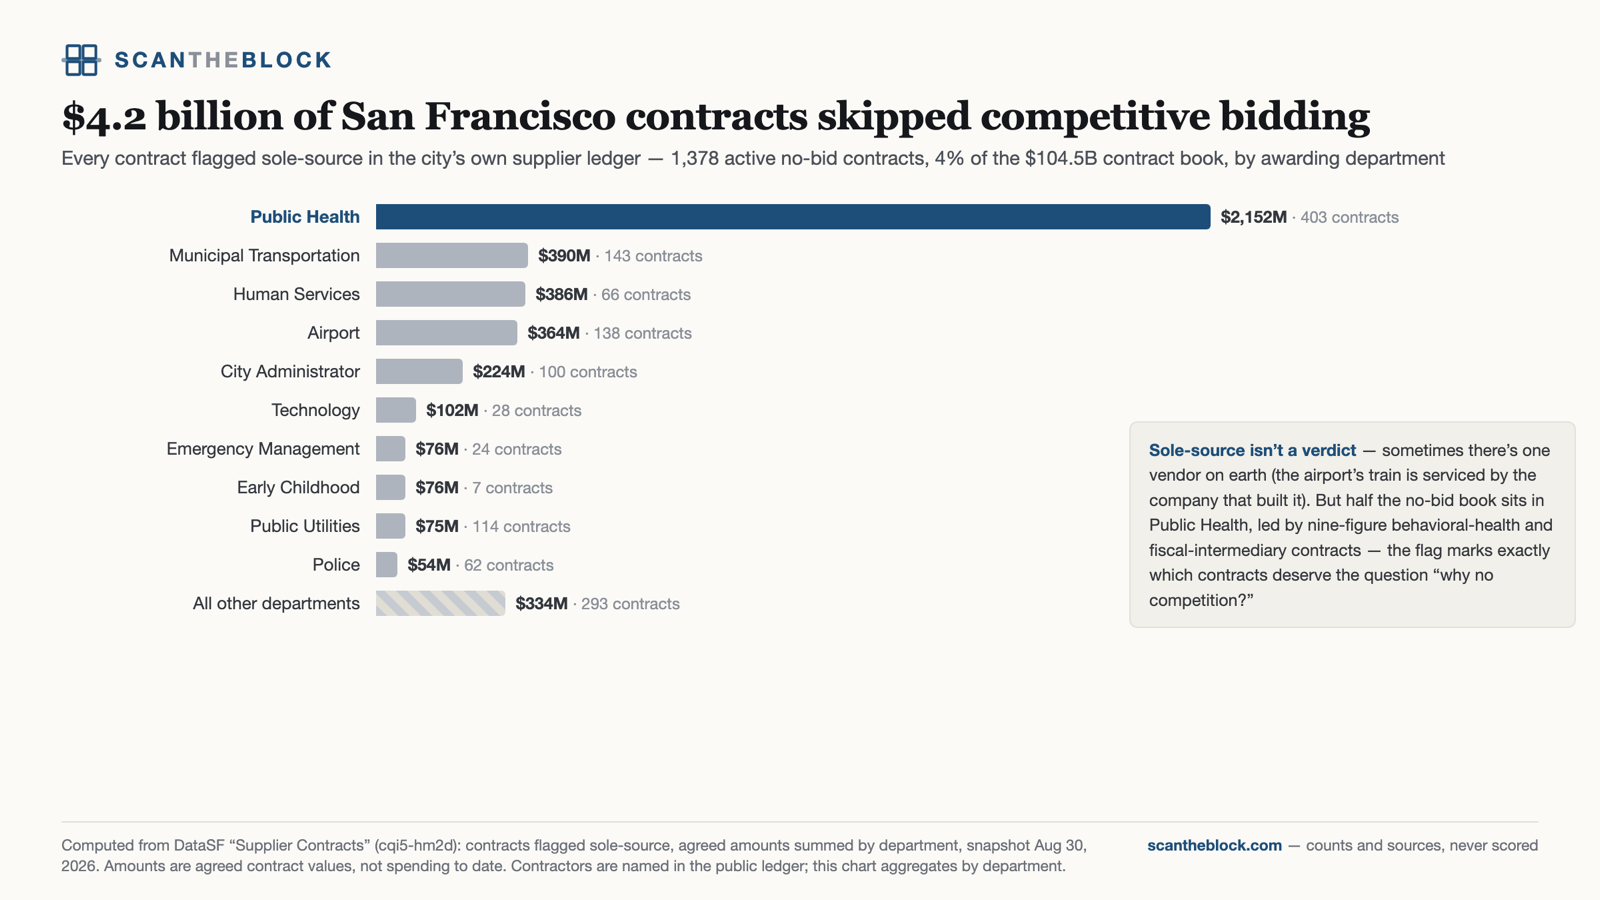
1,378 active contracts are flagged sole-source, worth $4.23B — about 4% of the city's $104.5B contract book — and half of that sits in Public Health. Sole-source is legal and sometimes unavoidable (the airport's train is serviced by the company that built it); the flag marks which contracts warrant the question rather than answering it.
Method. DataSF Supplier Contracts (cqi5-hm2d): contracts flagged sole-source, agreed amounts summed by department, snapshot Aug 30, 2026. Agreed amount is a multi-year contract ceiling, not money spent.
2026-08-30
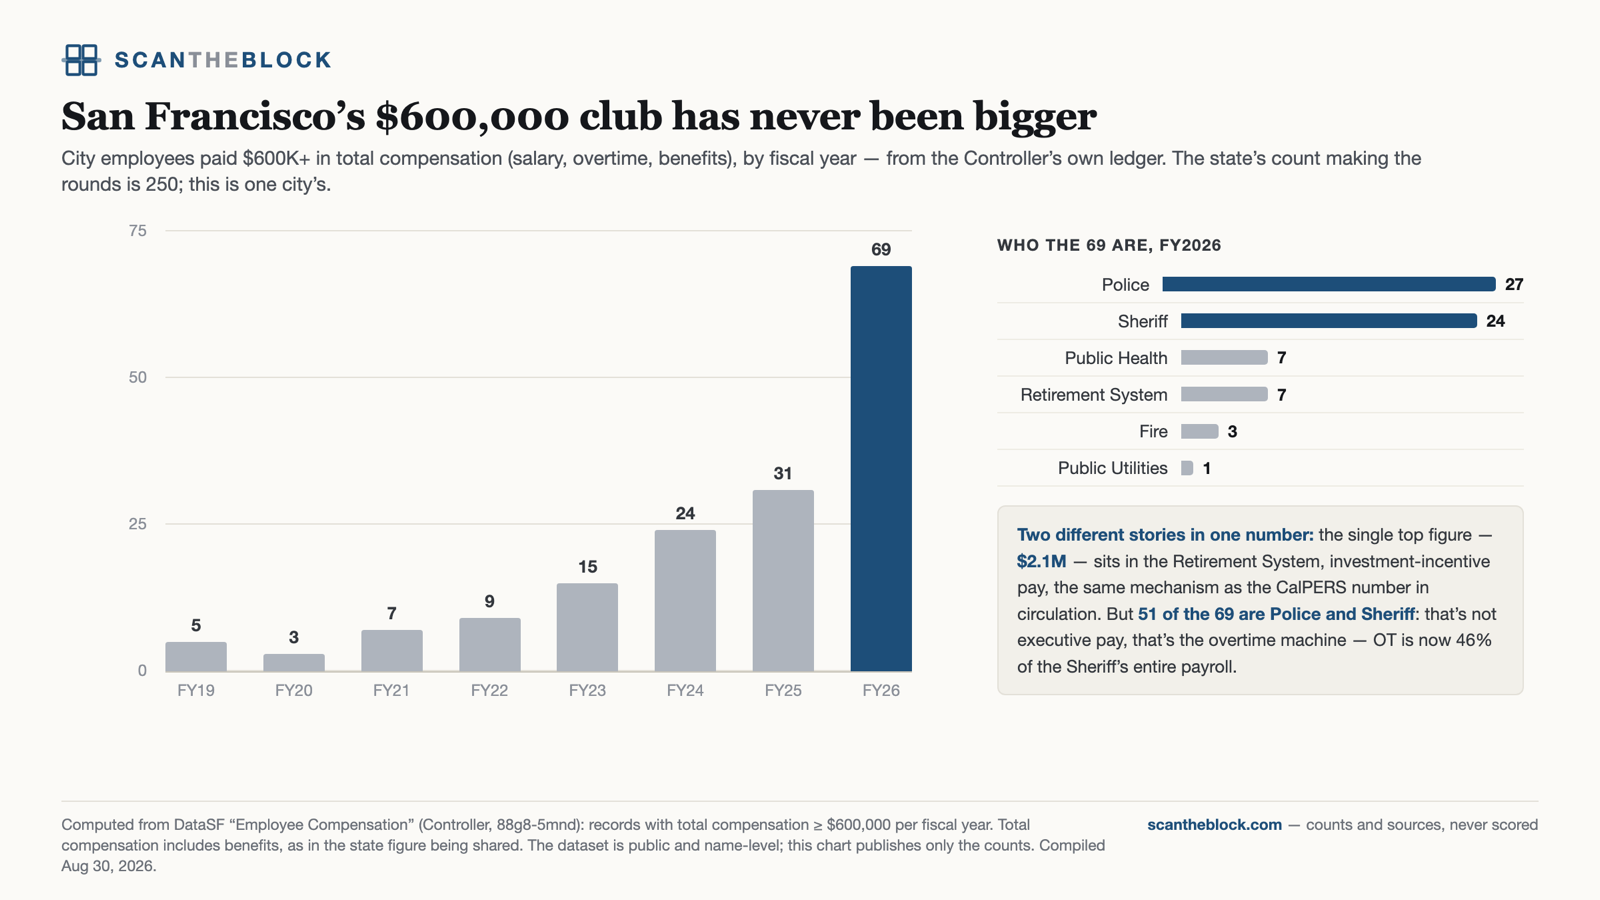
City employees paid $600,000 or more in total compensation went from 5 in FY2019 to 69 in FY2026, more than doubling in the last year alone. The single largest figure, $2.1M, is investment-incentive pay in the Retirement System — but 51 of the 69 are Police and Sheriff, which makes most of the list an overtime story rather than an executive-pay one.
Method. DataSF Employee Compensation (Controller, 88g8-5mnd): records with total compensation ≥ $600,000 per fiscal year, benefits included. The dataset is name-level and public; this chart publishes only counts.
2026-08-30
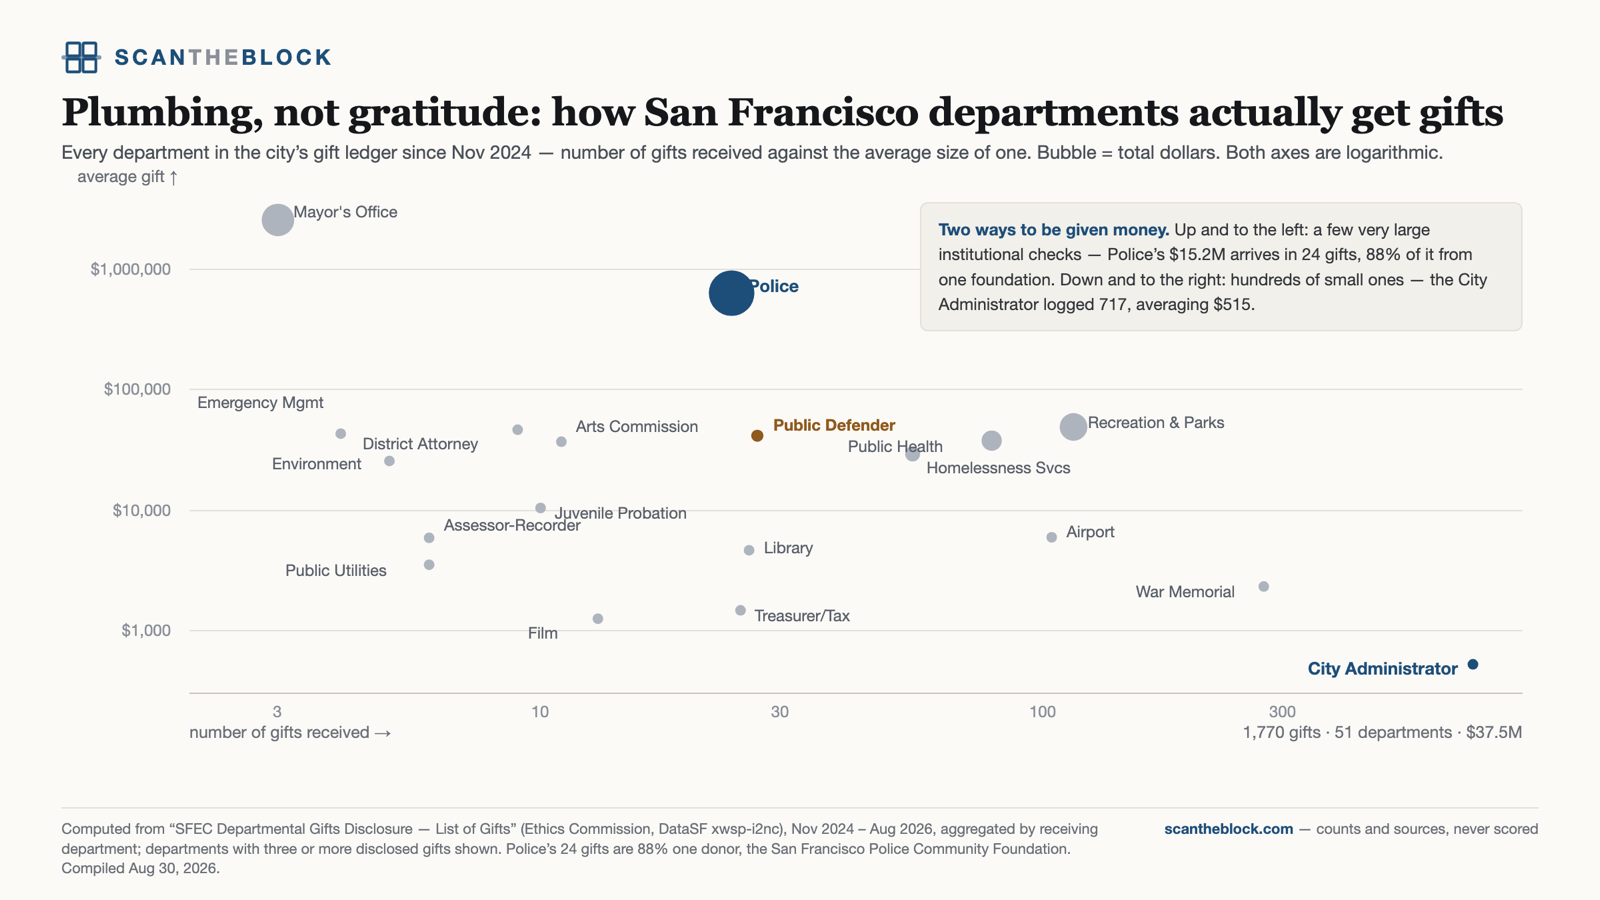
Every department in the city's gift ledger, plotted by number of gifts against average gift size. Receiving donations is widespread — 51 departments logged 1,770 gifts — but the distribution has two corners: Police took 24 gifts averaging $632,000, while the City Administrator took 717 averaging $515. What predicts large gifts is a companion foundation, not institutional temperament; the Public Defender, an office built to be adversarial, still took $1.1M.
Method. SFEC Departmental Gifts Disclosure — List of Gifts (Ethics Commission, DataSF xwsp-i2nc), Nov 2024 – Aug 2026, aggregated by receiving department; departments with three or more disclosed gifts shown. Police's 24 gifts are 88% one donor, the San Francisco Police Community Foundation.
2026-08-30
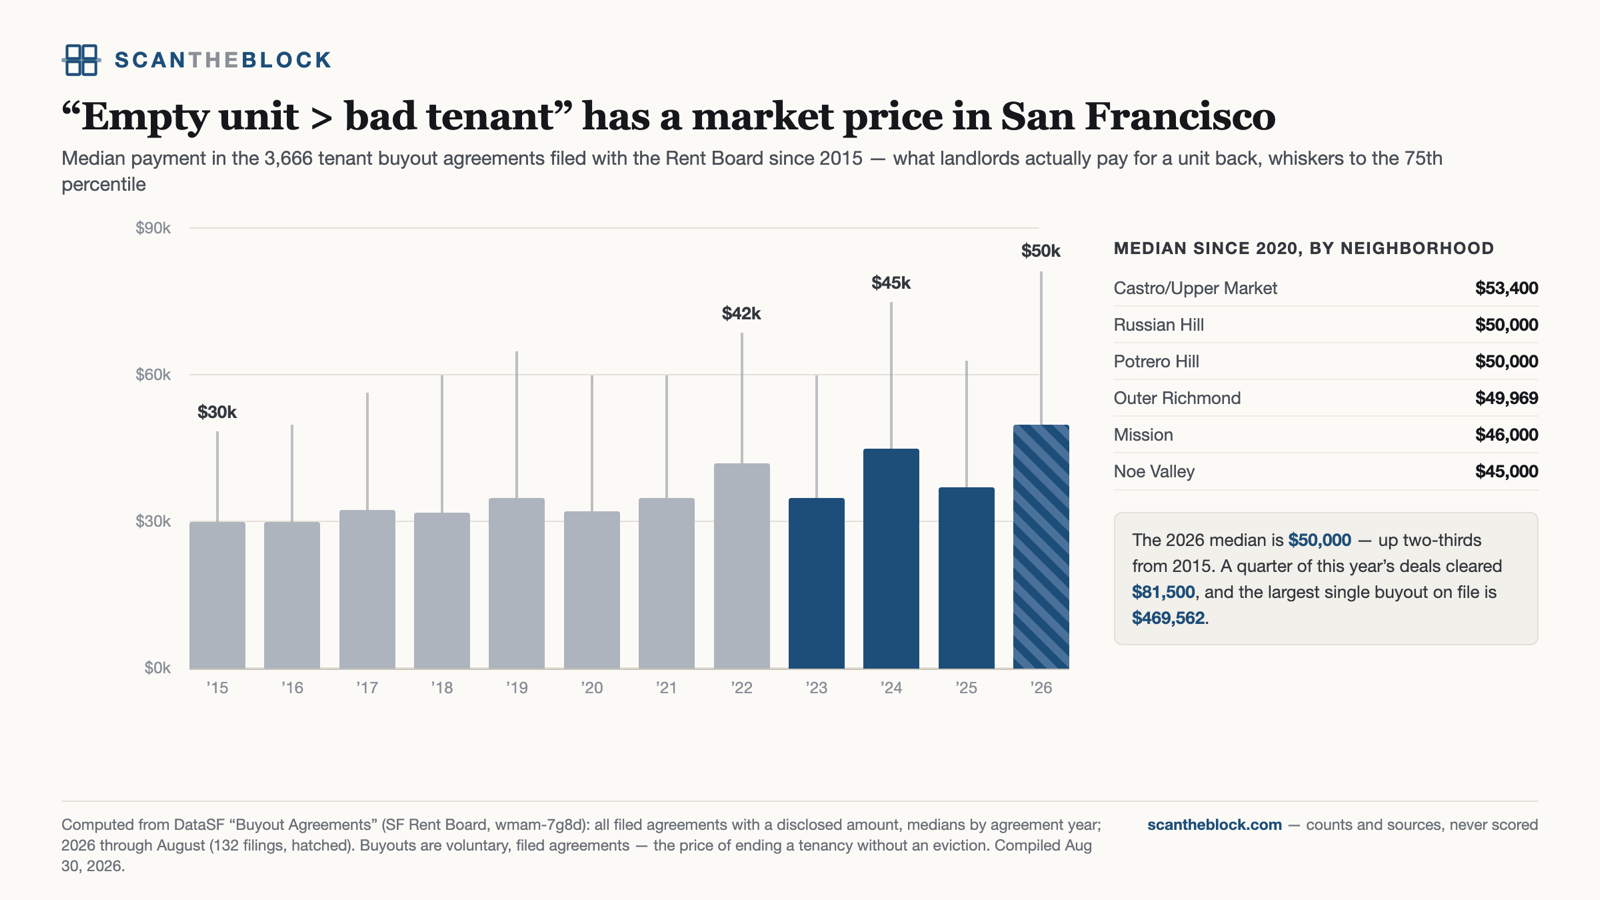
Every tenant buyout in San Francisco must be filed with the Rent Board. Across 3,666 agreements since 2015, the median payment rose from $30,000 to $50,000 in 2026 — up two-thirds. A quarter of this year's deals cleared $81,500, and the largest single buyout on file is $469,562. By neighborhood since 2020, Castro/Upper Market leads at a $53,400 median.
Method. DataSF Buyout Agreements (SF Rent Board, wmam-7g8d): all filed agreements with a disclosed amount, medians by agreement year; 2026 through August. Buyouts are voluntary filed agreements — the price of ending a tenancy without an eviction.
2026-08-30
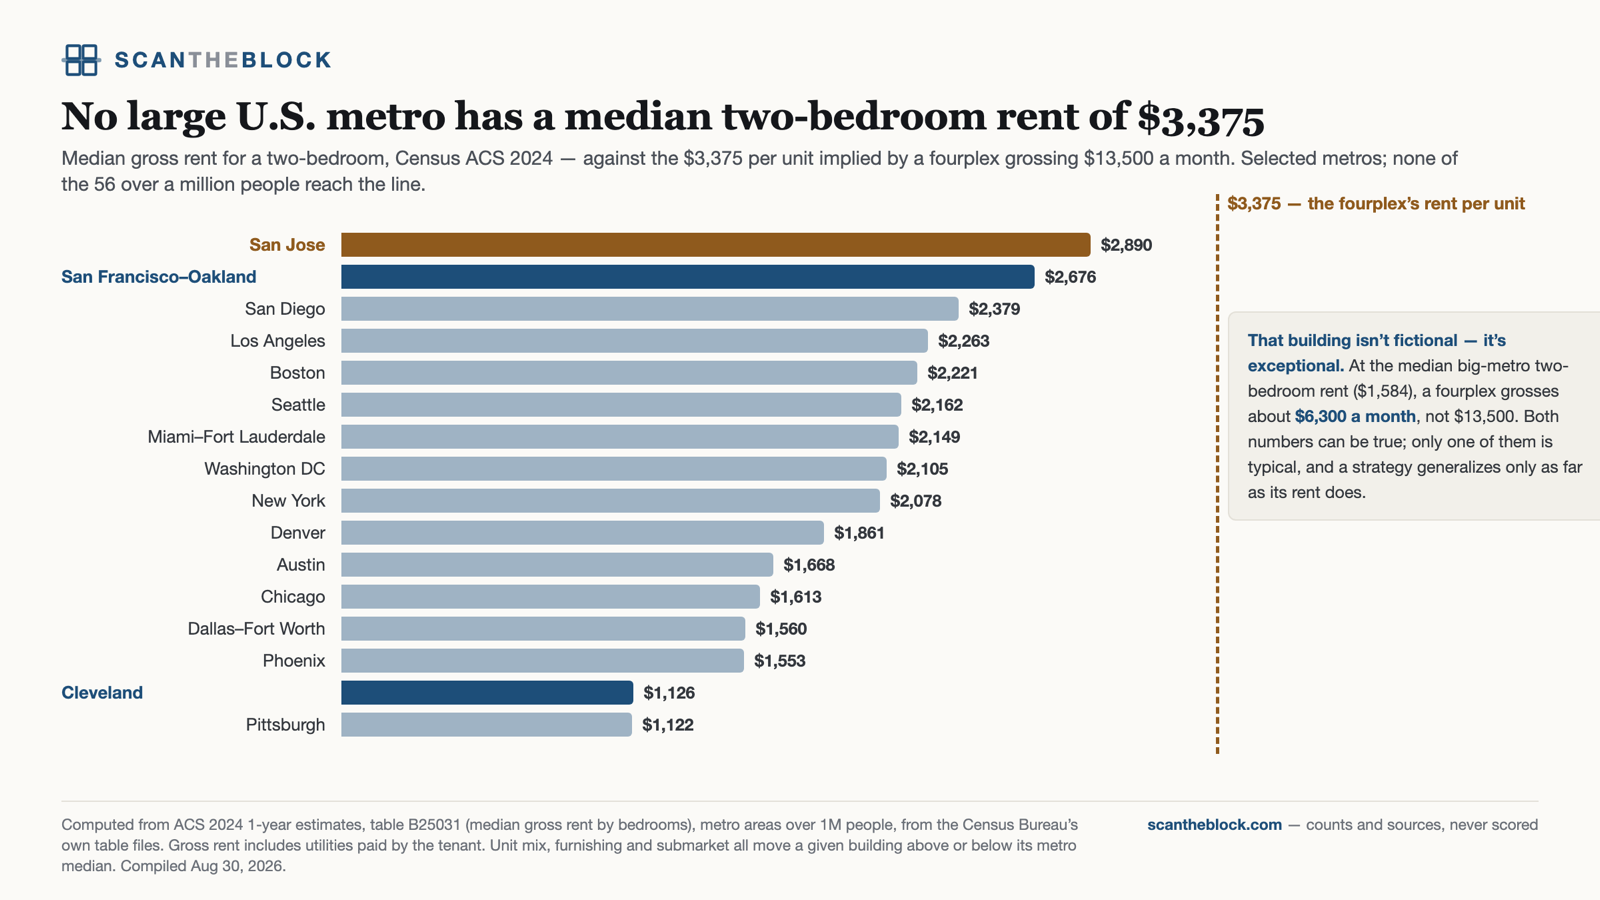
A fourplex grossing $13,500 a month implies $3,375 per unit — above the median two-bedroom rent in every one of the 56 metros over a million people. San Jose, the most expensive rental market in the country, is $2,890. At the median big-metro two-bedroom ($1,584), a fourplex grosses about $6,300.
Method. ACS 2024 1-year estimates, table B25031 (median gross rent by bedrooms), metros over 1M people, from the Census Bureau's table files. Gross rent includes tenant-paid utilities; unit mix, furnishing and submarket move any given building off its metro median.
2026-08-30
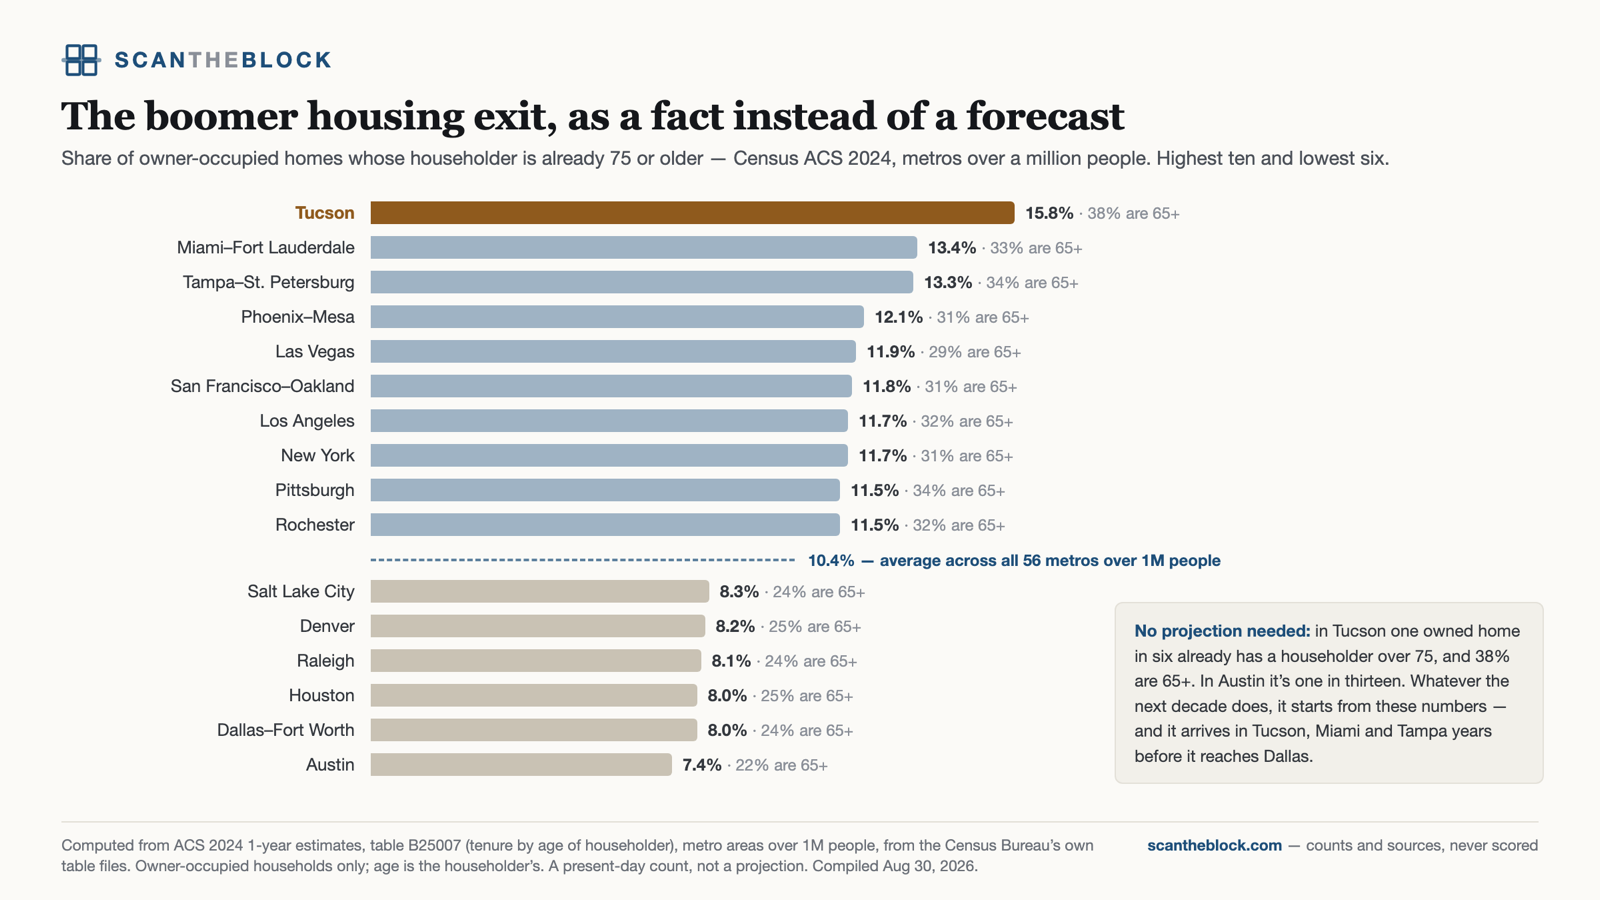
The share of owner-occupied homes whose householder is already 75 or older, today, with no projection involved. Tucson is at 15.8% (and 38% are 65+), Miami 13.4%, Tampa 13.3% — against Austin at 7.4% and Dallas and Houston at 8.0%. Whatever the next decade does, it starts from these numbers, and it arrives in the retirement metros years before it reaches Texas.
Method. ACS 2024 1-year estimates, table B25007 (tenure by age of householder), metros over 1M people. Owner-occupied households only; age is the householder's.
2026-08-30
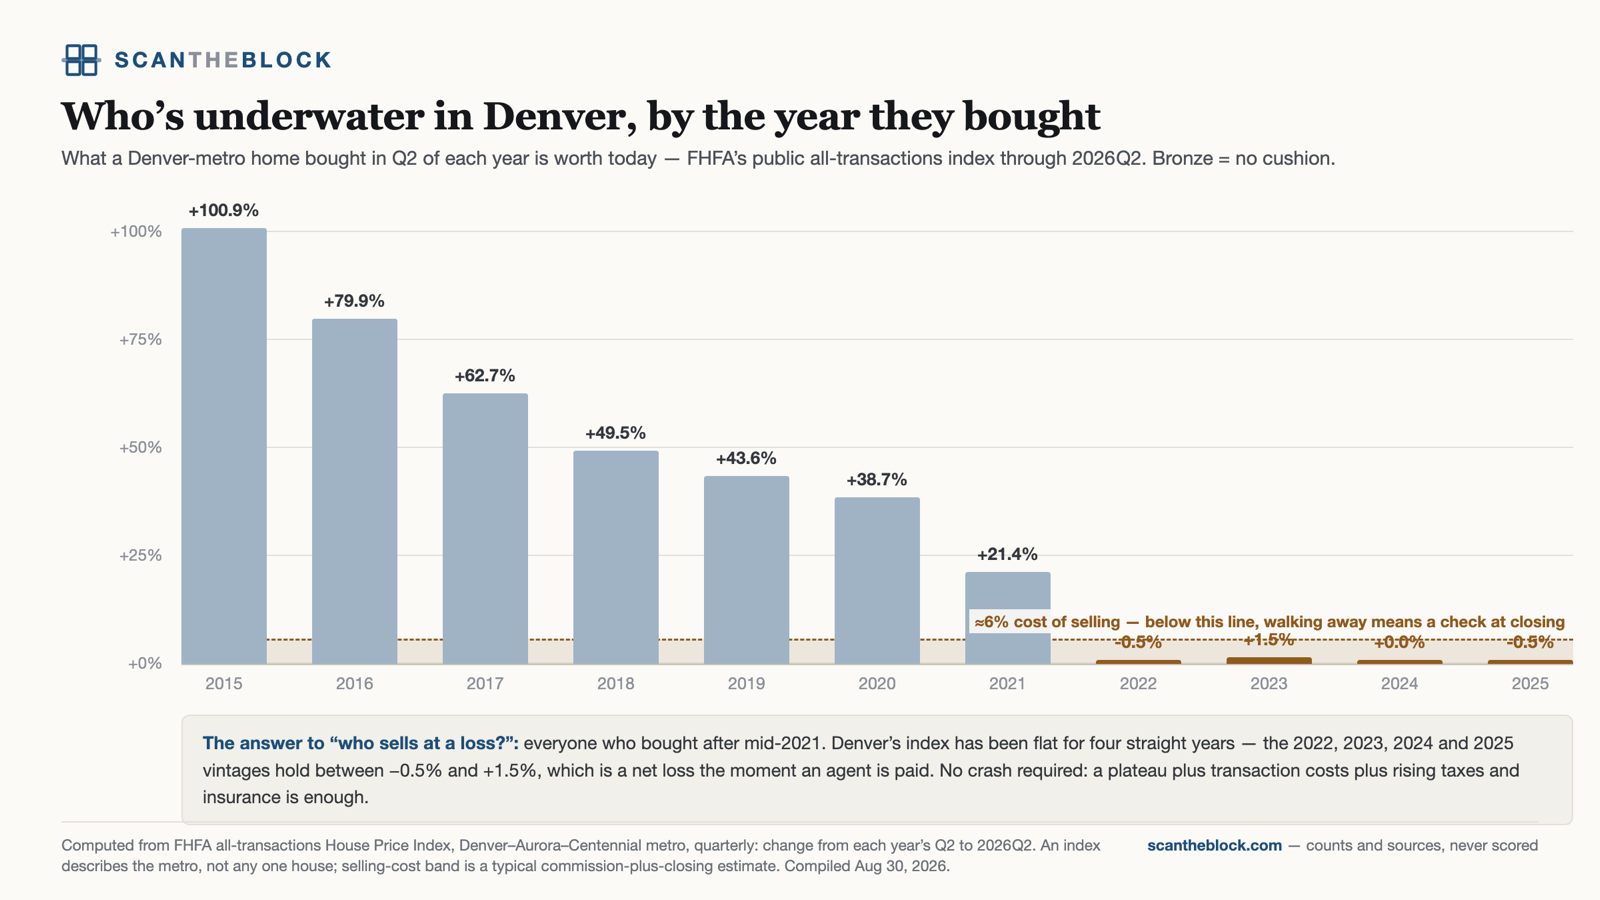
What a Denver-metro home bought in each year is worth today. Purchases through 2021 hold real cushion (2015: +101%, 2021: +21%), then the market goes flat — the 2022, 2023, 2024 and 2025 vintages sit between −0.5% and +1.5%, which is a net loss once selling costs are paid. No crash required: a four-year plateau plus transaction costs is enough to put recent buyers underwater.
Method. FHFA all-transactions House Price Index, Denver–Aurora–Centennial metro: change from each year's Q2 to 2026 Q2. An index describes the metro, not any individual house; the selling-cost band is a typical commission-plus-closing estimate.
2026-08-30
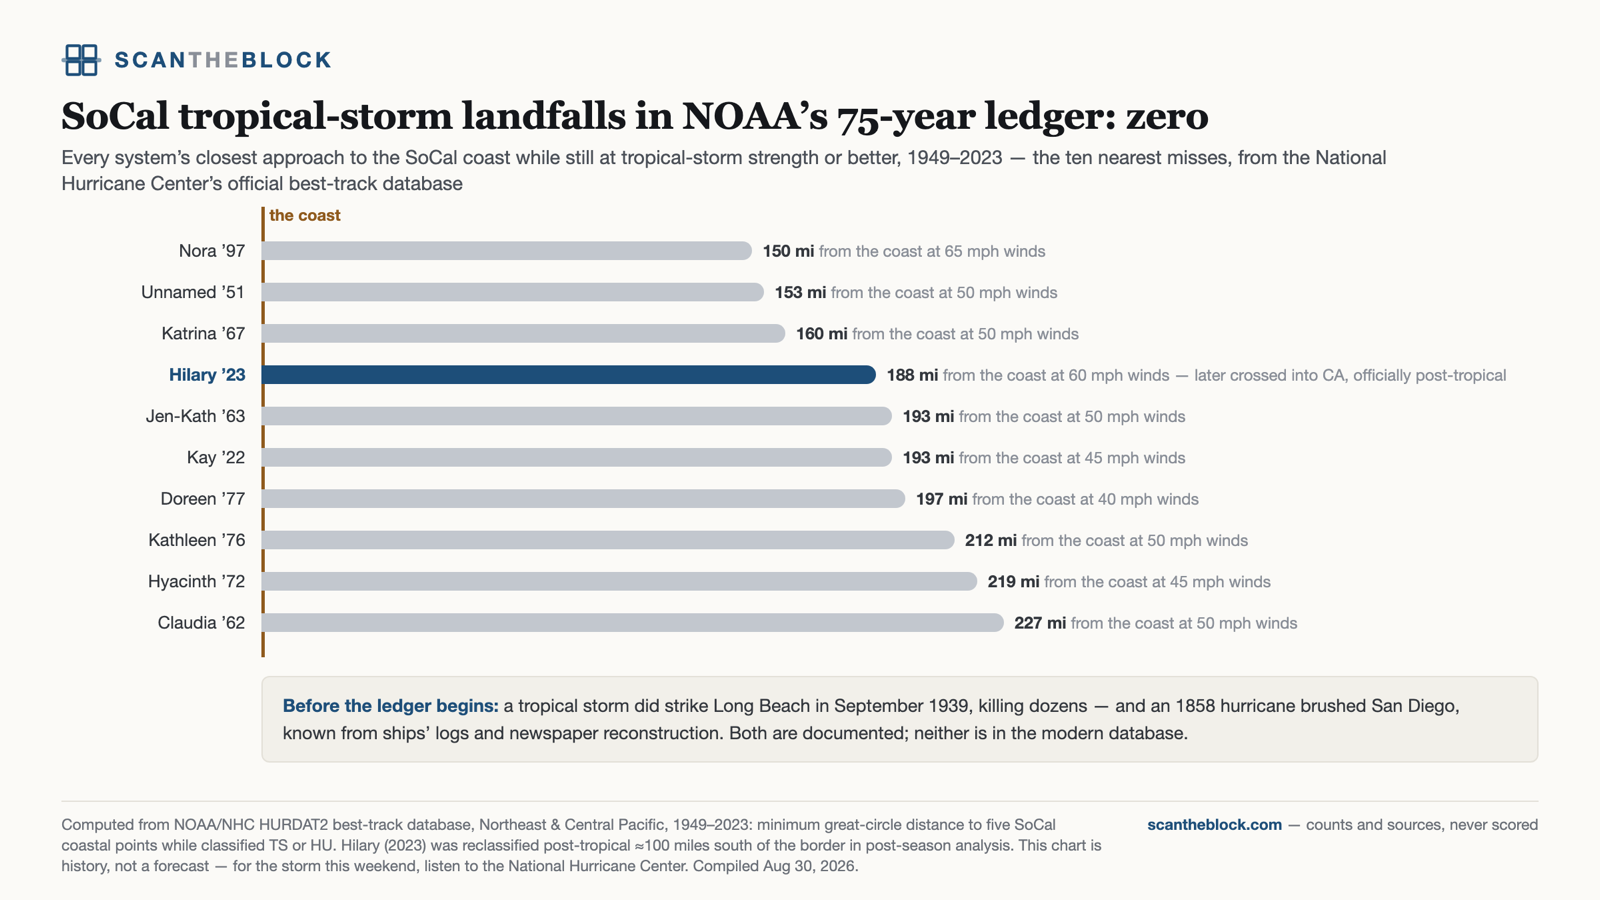
Every system's closest approach to the Southern California coast while still at tropical-storm strength or better, 1949–2023. None made landfall; the ten nearest misses all stayed 150 miles or more offshore, and even Hilary (2023) was reclassified post-tropical about 100 miles south of the border. Before the modern database: a tropical storm did strike Long Beach in 1939, and an 1858 hurricane brushed San Diego.
Method. NOAA/NHC HURDAT2 best-track database, Northeast and Central Pacific: minimum great-circle distance to five SoCal coastal points while classified tropical storm or hurricane. History, not a forecast — for any active storm, the National Hurricane Center is the source.
2026-08-30
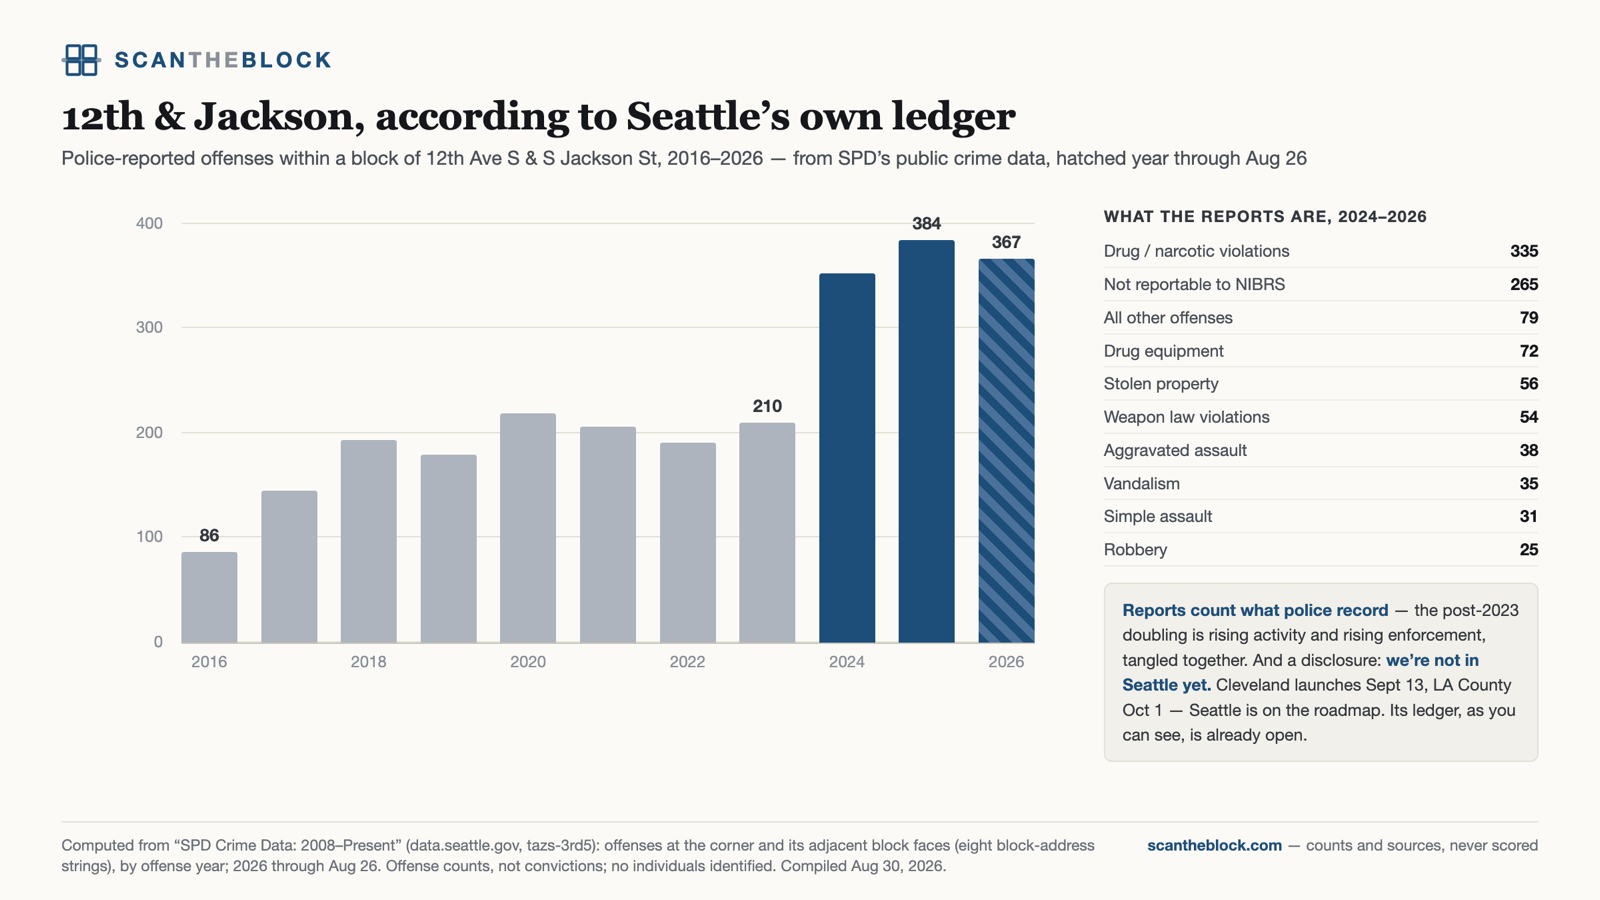
Police-reported offenses within a block of 12th Ave S and S Jackson St rose from 210 in 2023 to 384 in 2025, with 367 already logged by late August 2026 — roughly four times the 2016 count. The top category by a wide margin is drug and narcotic violations, followed by stolen property, weapons and assault.
Method. SPD Crime Data: 2008–Present (data.seattle.gov, tazs-3rd5): offenses at the intersection and its adjacent block faces, by offense year. Incident reports count what police record, not what happens, so the rise mixes street activity with enforcement; 31% of the corner's logged incidents fall between 11pm and 7am, and the busiest logged hour is 1pm.
2026-08-30
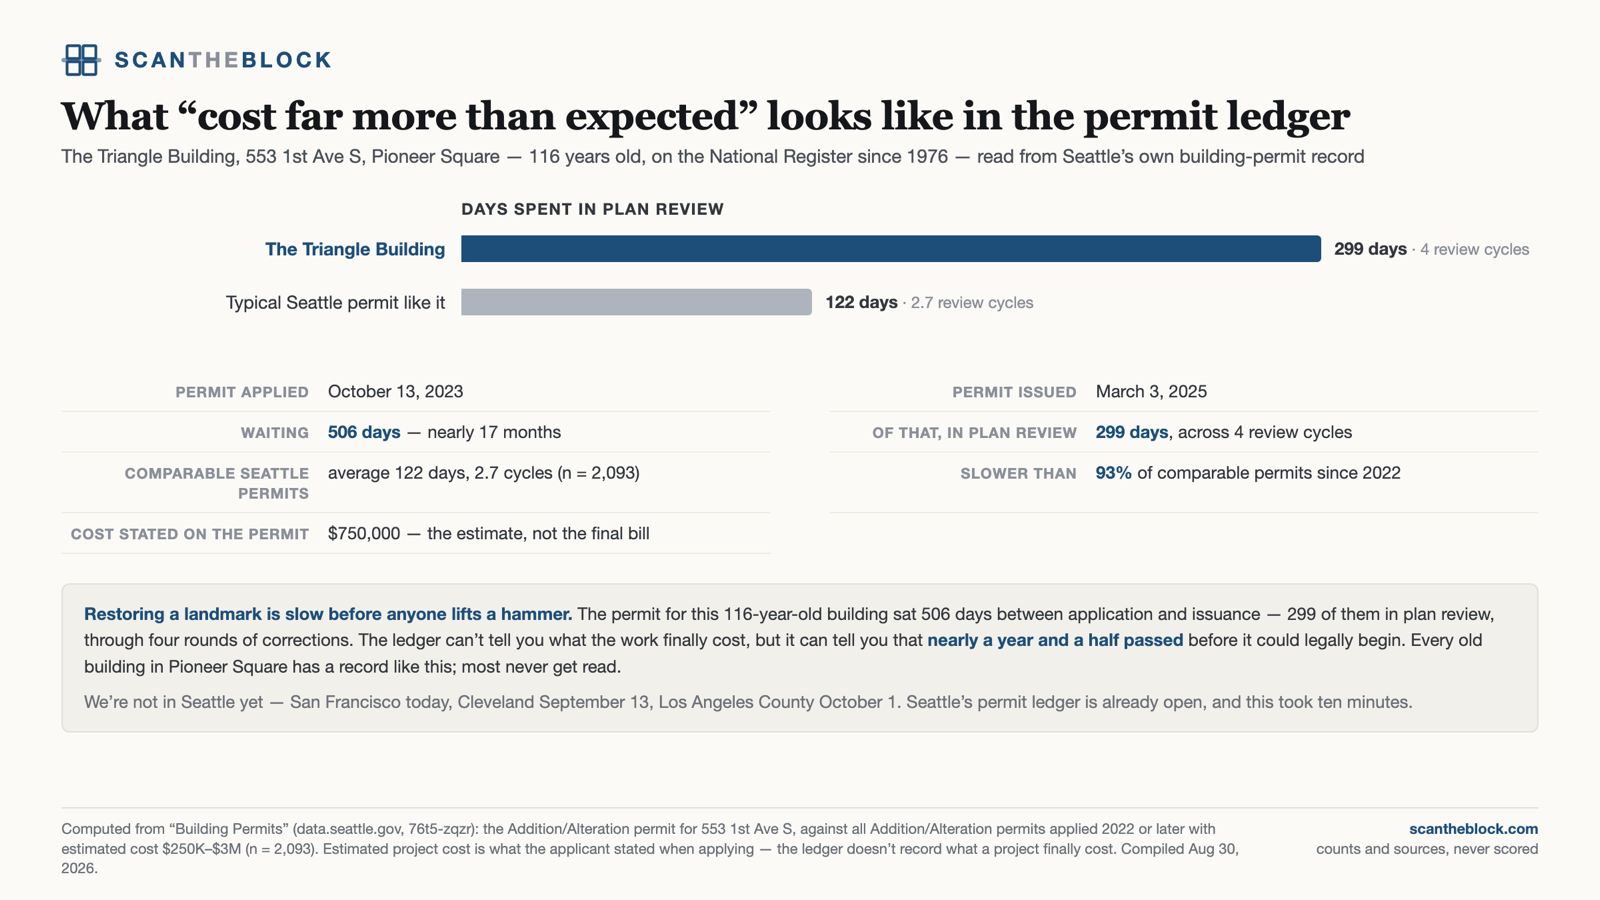
The restoration permit for the 116-year-old Triangle Building in Pioneer Square was applied for in October 2023 and issued in March 2025 — 506 days, of which 299 were in plan review across four correction cycles. Comparable Seattle permits average 122 days and 2.7 cycles; this one was slower than 93% of them. Carrying a vacant landmark for seventeen months before work can legally begin is its own line item.
Method. Building Permits (data.seattle.gov, 76t5-zqzr): the Addition/Alteration permit for 553 1st Ave S against all Addition/Alteration permits applied 2022 or later with estimated cost $250K–$3M (n = 2,093). Estimated project cost is what the applicant stated when applying — the ledger does not record final cost.
2026-08-30
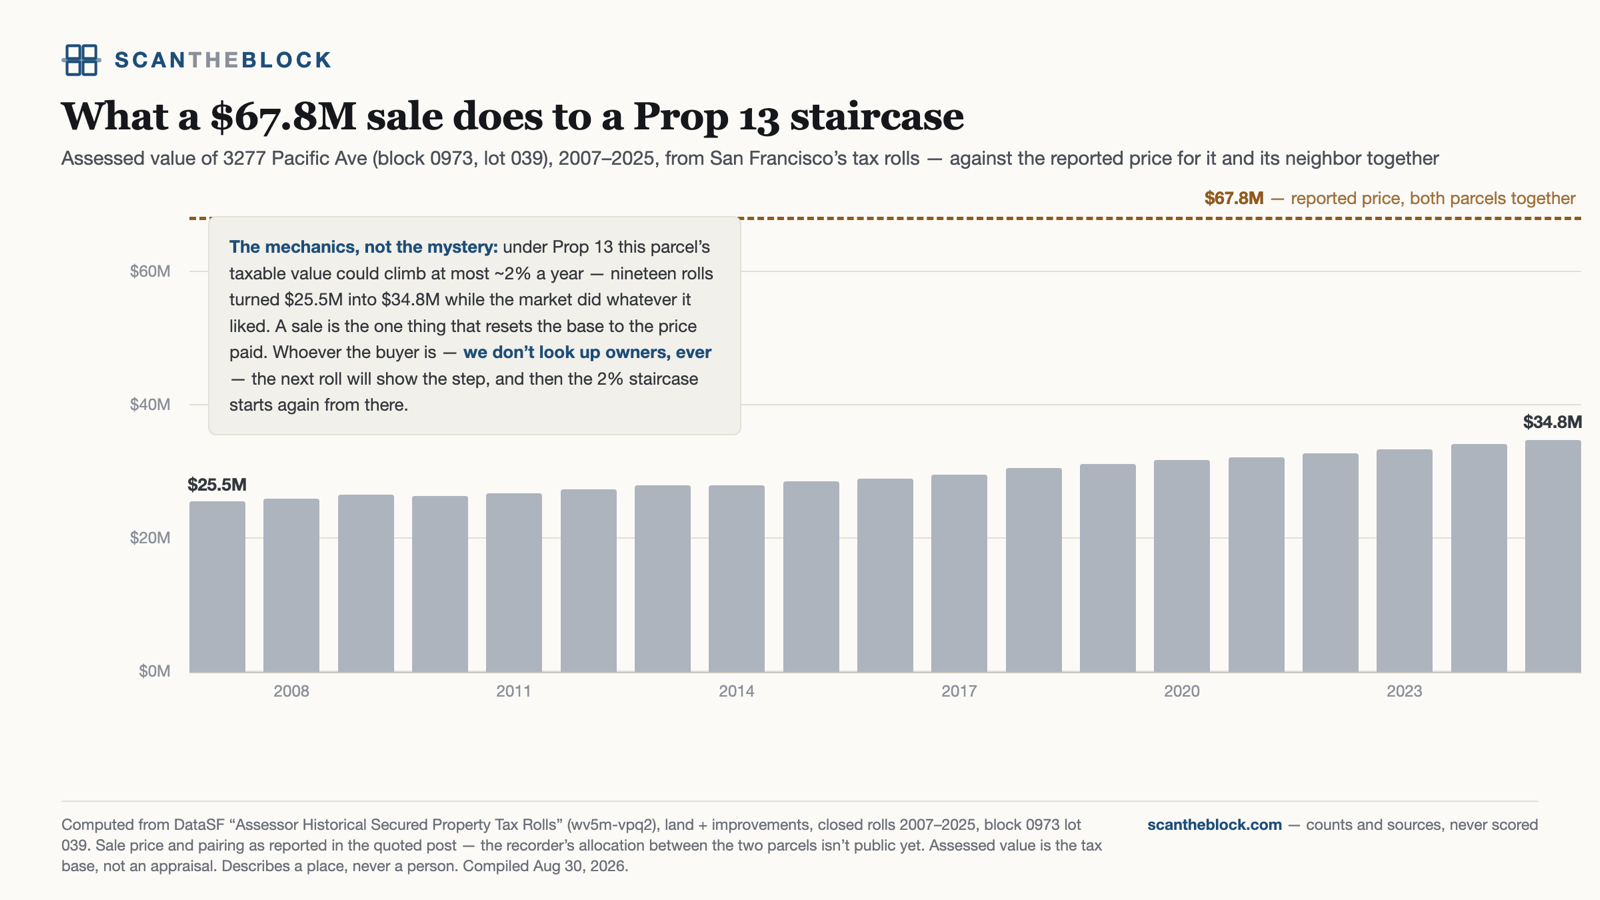
Assessed value of 3277 Pacific Avenue, 2007–2025. Under Proposition 13 the taxable base could rise at most about 2% a year, so nineteen rolls turned $25.5M into $34.8M while the market did as it pleased. A sale is the one event that resets the base to the price paid — after which the 2% staircase restarts from the new height.
Method. DataSF Assessor Historical Secured Property Tax Rolls (wv5m-vpq2), land plus improvements, closed rolls 2007–2025, block 0973 lot 039. Assessed value is the tax base, not an appraisal. Sale price as reported publicly; the recorder's allocation between parcels was not yet public. Describes a place, never a person.
2026-08-30
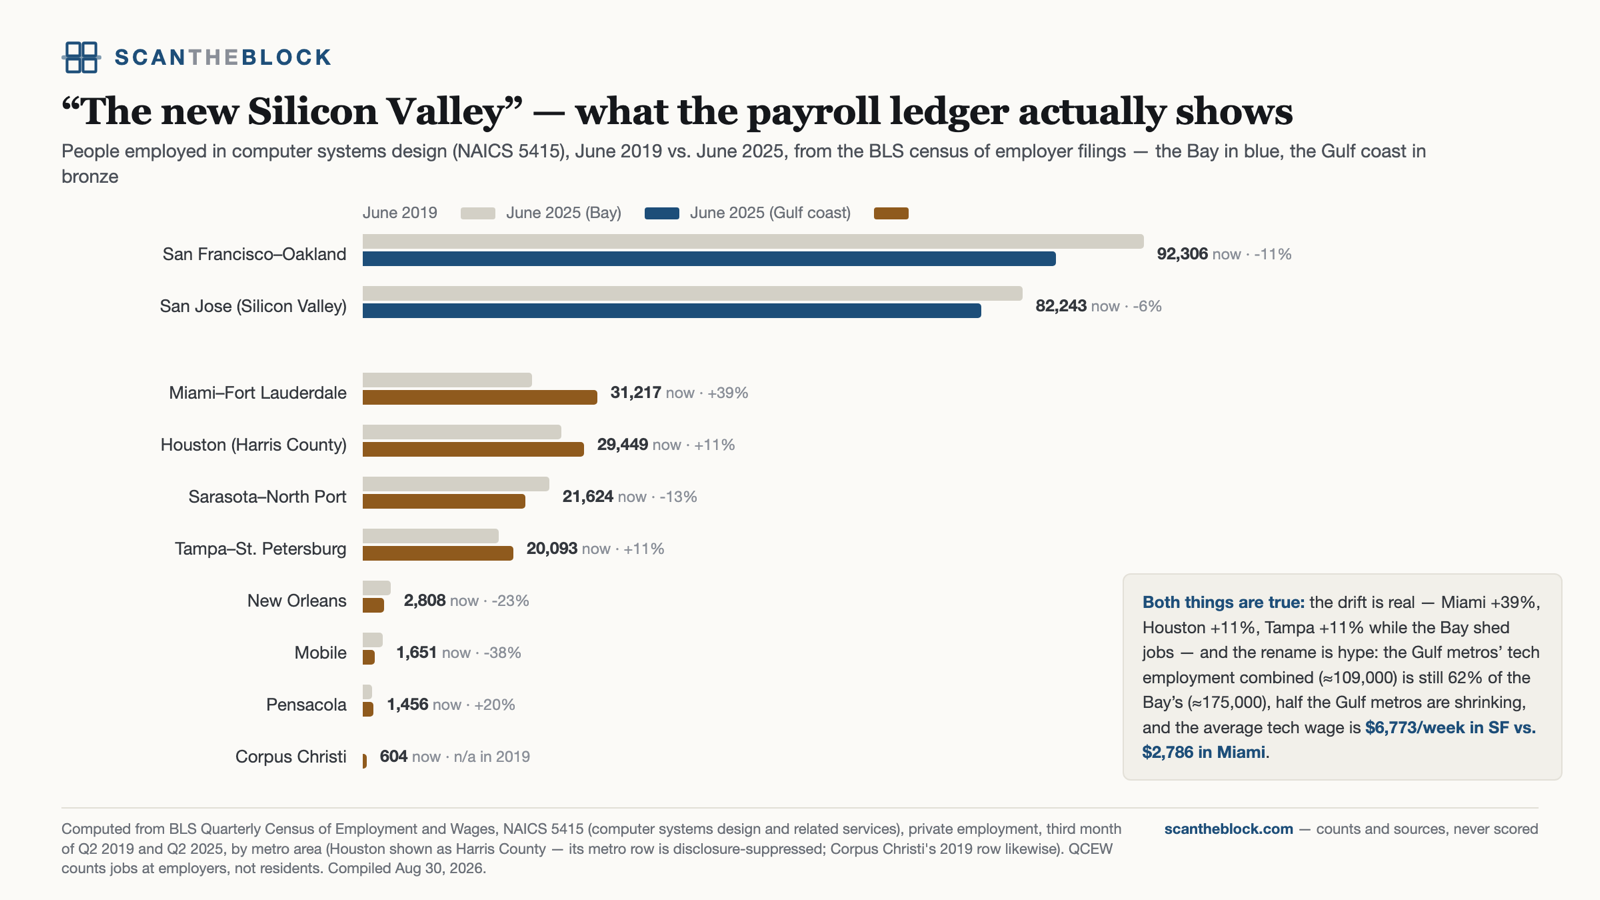
Tech employment in computer systems design, June 2019 against June 2025. The drift south is real — Miami +39%, Houston +11%, Tampa +11%, while San Francisco–Oakland shed 11% and San Jose 6%. The rename is not: the Gulf coast metros combined hold about 109,000 such jobs against the Bay's 175,000, half the Gulf metros are shrinking, and the average weekly tech wage is $6,773 in San Francisco against $2,786 in Miami.
Method. BLS Quarterly Census of Employment and Wages, NAICS 5415 (computer systems design and related services), private employment, third month of Q2 in each year, by metro. Houston appears as Harris County because its metro row is disclosure-suppressed. QCEW counts jobs at employers, not remote residents.
2026-08-30
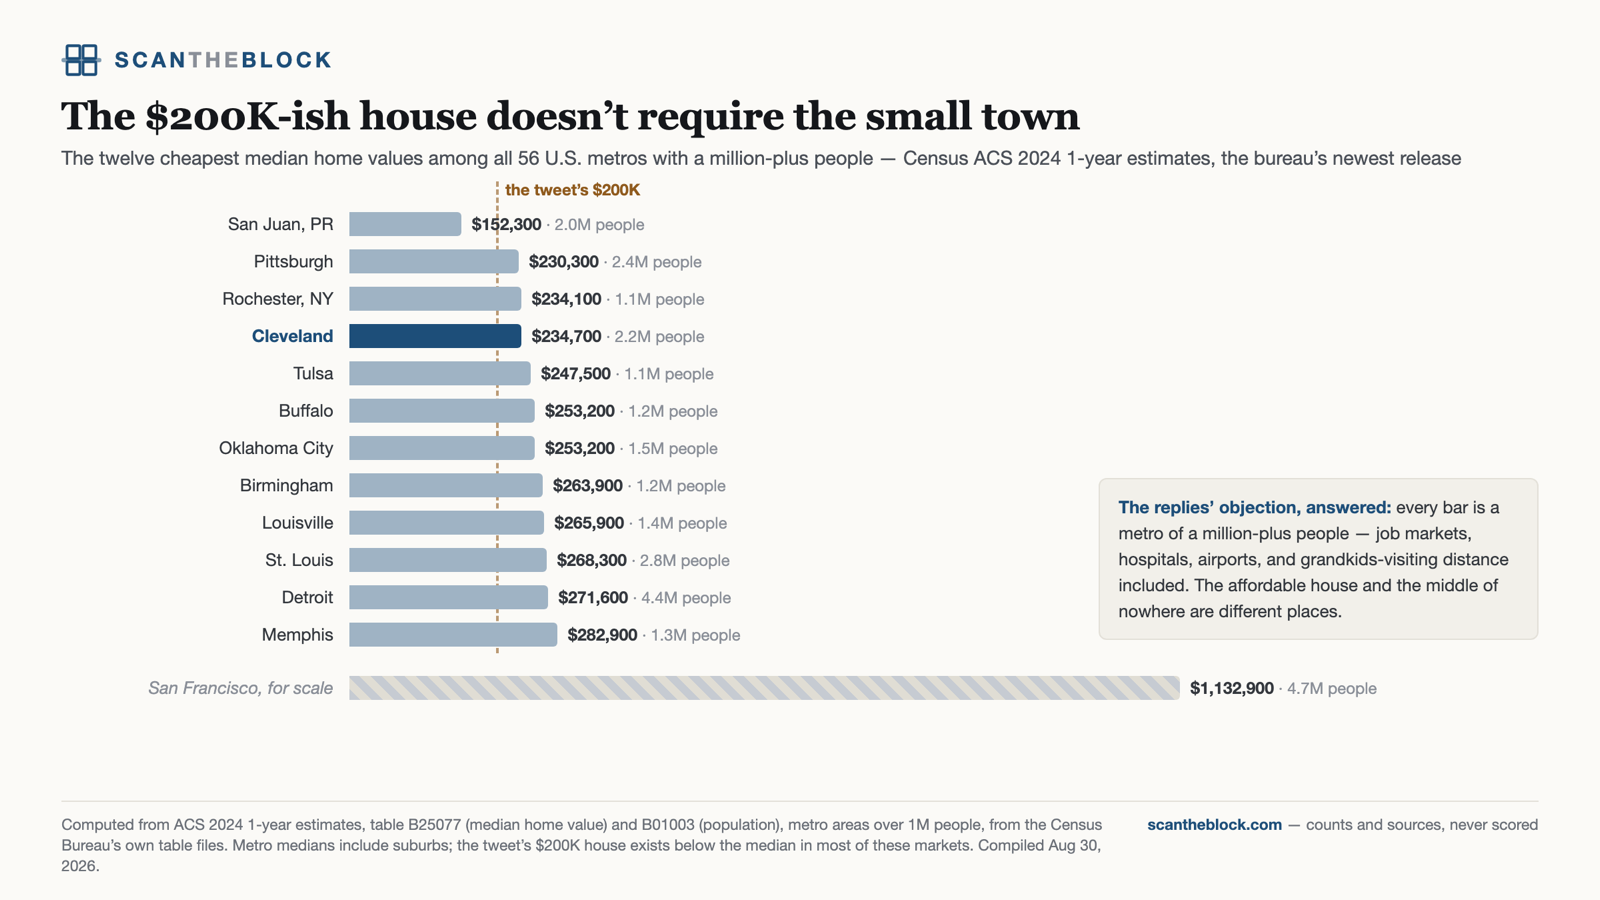
The twelve cheapest median home values among all 56 U.S. metros with a million-plus people. Pittsburgh $230,300, Rochester $234,100, Cleveland $234,700, Tulsa $247,500, Buffalo and Oklahoma City $253,200 — every one of them a metro with a job market, hospitals and an airport. San Francisco, for scale, is $1,132,900.
Method. ACS 2024 1-year estimates, tables B25077 (median home value) and B01003 (population), metros over 1M people. Metro medians include suburbs, so the individual affordable house typically sits below these figures.
2026-08-30
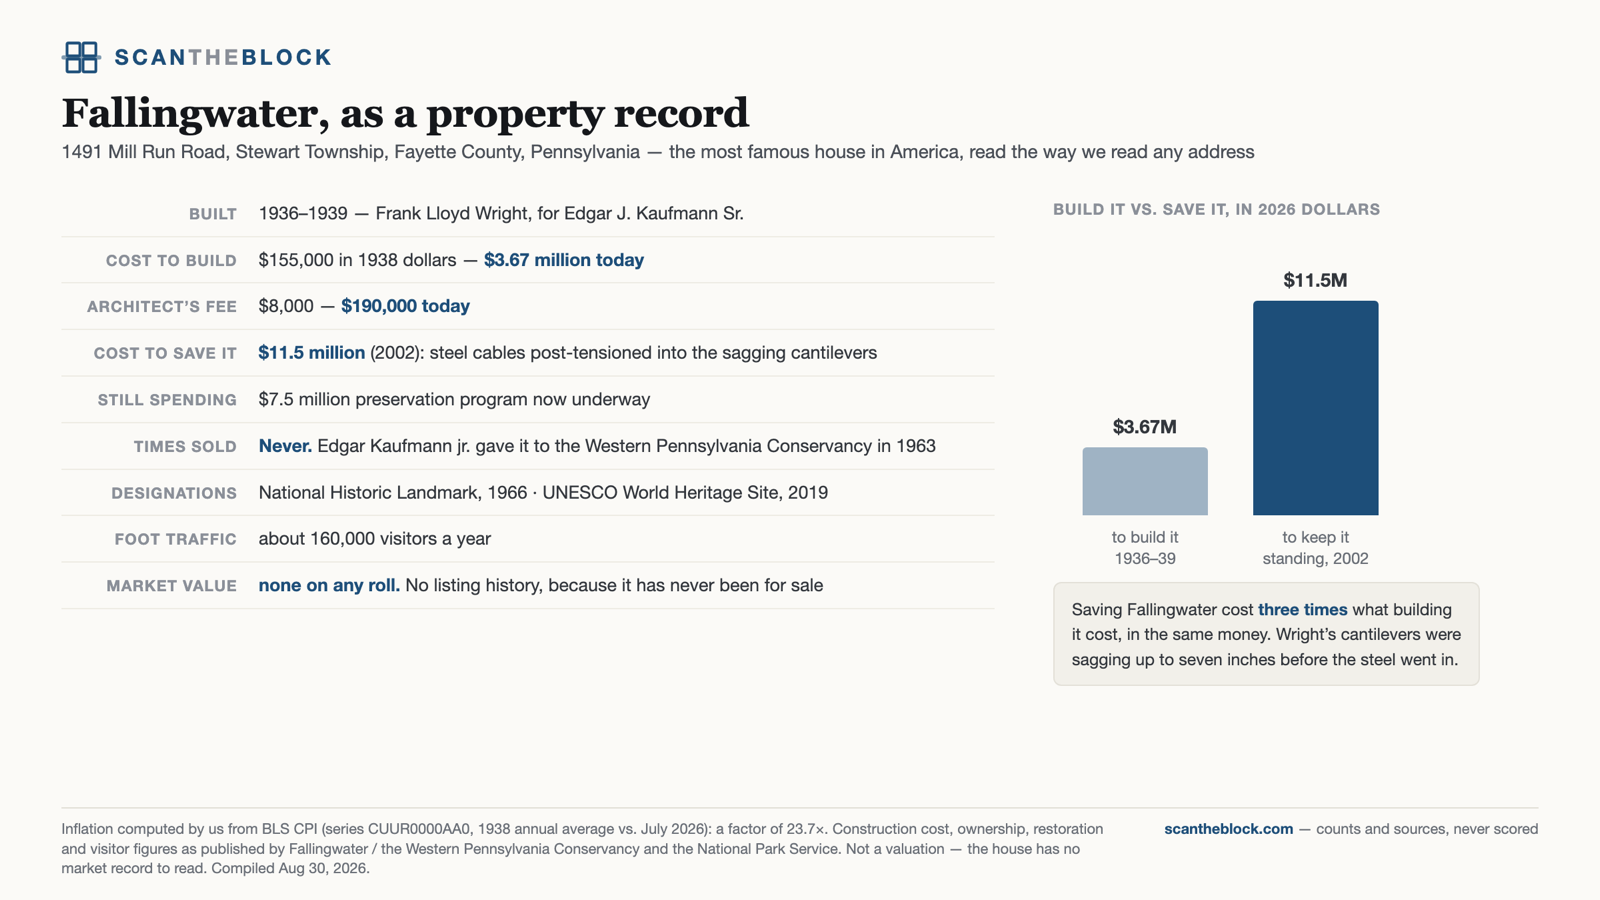
The most famous house in America, read the way we read any address. Built 1936–39 for $155,000 — about $3.67M in today's money — with an architect's fee of $8,000. The 2002 structural rescue, post-tensioning steel into cantilevers that had sagged up to seven inches, cost $11.5M: three times the real cost of building it. Times sold: never. Market value: none on any roll, because it has never been for sale.
Method. Inflation computed from BLS CPI (series CUUR0000AA0, 1938 annual average against July 2026 — a factor of 23.7). Construction cost, ownership, restoration and visitor figures as published by Fallingwater / the Western Pennsylvania Conservancy and the National Park Service. Not a valuation — the house has no market record to read.
2026-08-30
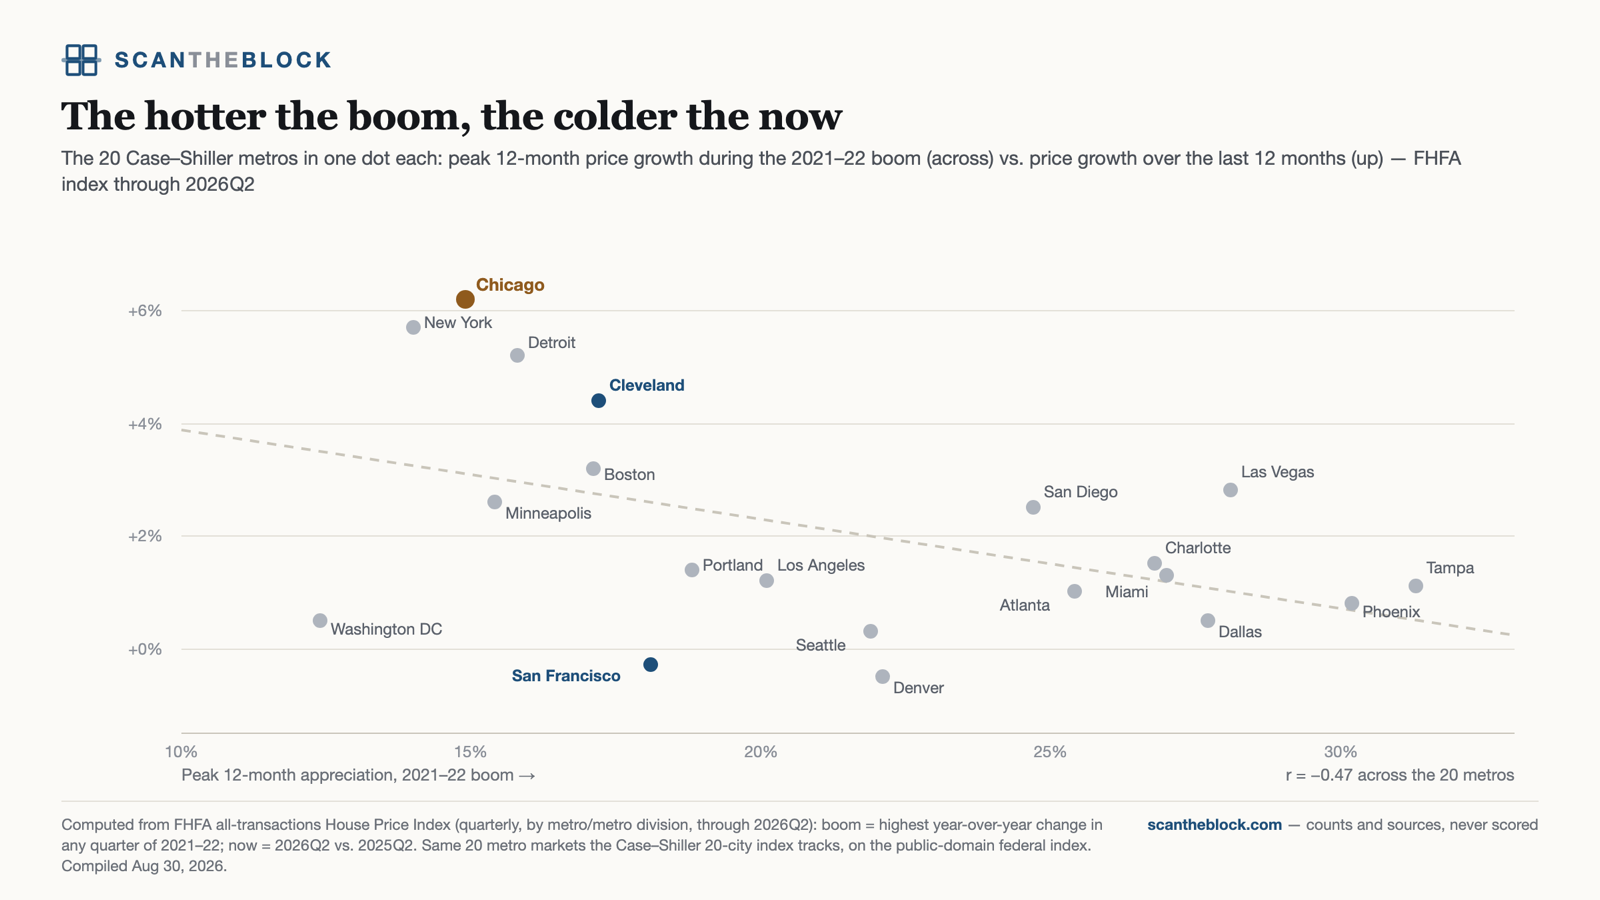
The twenty metro markets the Case–Shiller 20-city index tracks, one dot each: peak 12-month price growth during the 2021–22 boom against price growth over the last 12 months. The relationship is inverse (r = −0.47) — 2021's coolest markets (Chicago, New York, Detroit, Cleveland) now lead the country, and 2021's hottest (Tampa, Phoenix, Las Vegas, Dallas) run flat.
Method. FHFA all-transactions House Price Index, quarterly by metro or metro division, through 2026 Q2. Boom = highest year-over-year change in any quarter of 2021–22; now = 2026 Q2 over 2025 Q2. Built on the public-domain federal index rather than the licensed Case–Shiller series, so exact percentages differ slightly from Case–Shiller figures.
2026-08-30
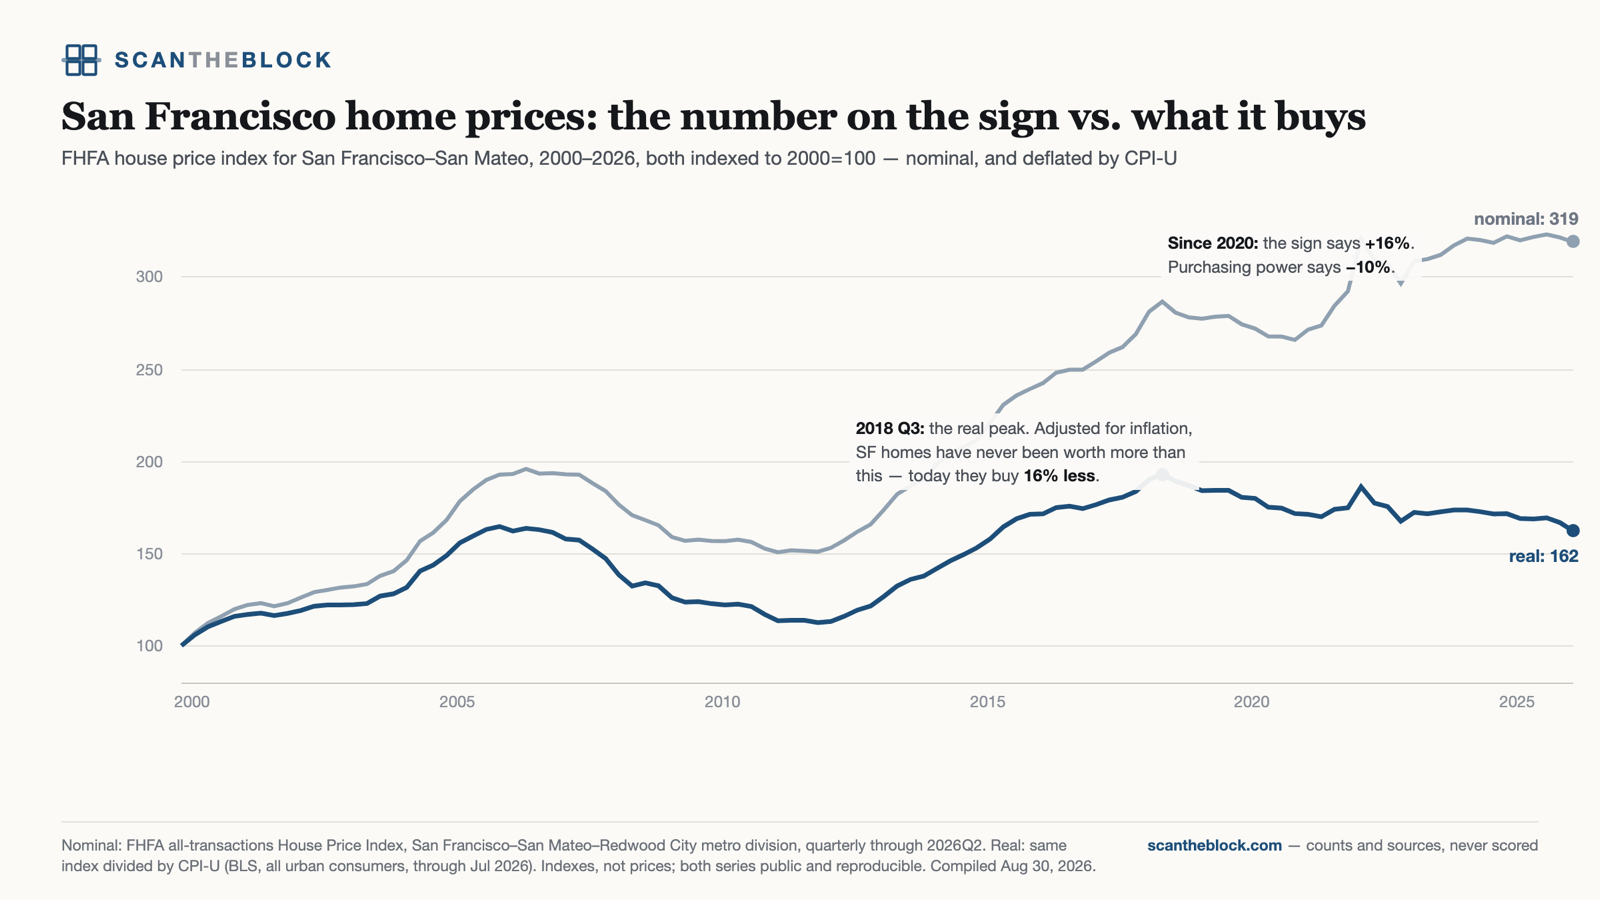
The FHFA house price index for San Francisco–San Mateo, 2000–2026, nominal and CPI-deflated, both indexed to 2000 = 100. Nominal prices sit at an effective record; in purchasing-power terms the market peaked in 2018 Q3 and has given back 16% since. Since 2020 Q1 alone: +16% nominal, −10% real.
Method. Nominal: FHFA all-transactions HPI, San Francisco–San Mateo–Redwood City metro division, quarterly through 2026 Q2. Real: the same index divided by CPI-U (BLS, all urban consumers, through July 2026). Indexes, not dollar prices.
2026-08-30
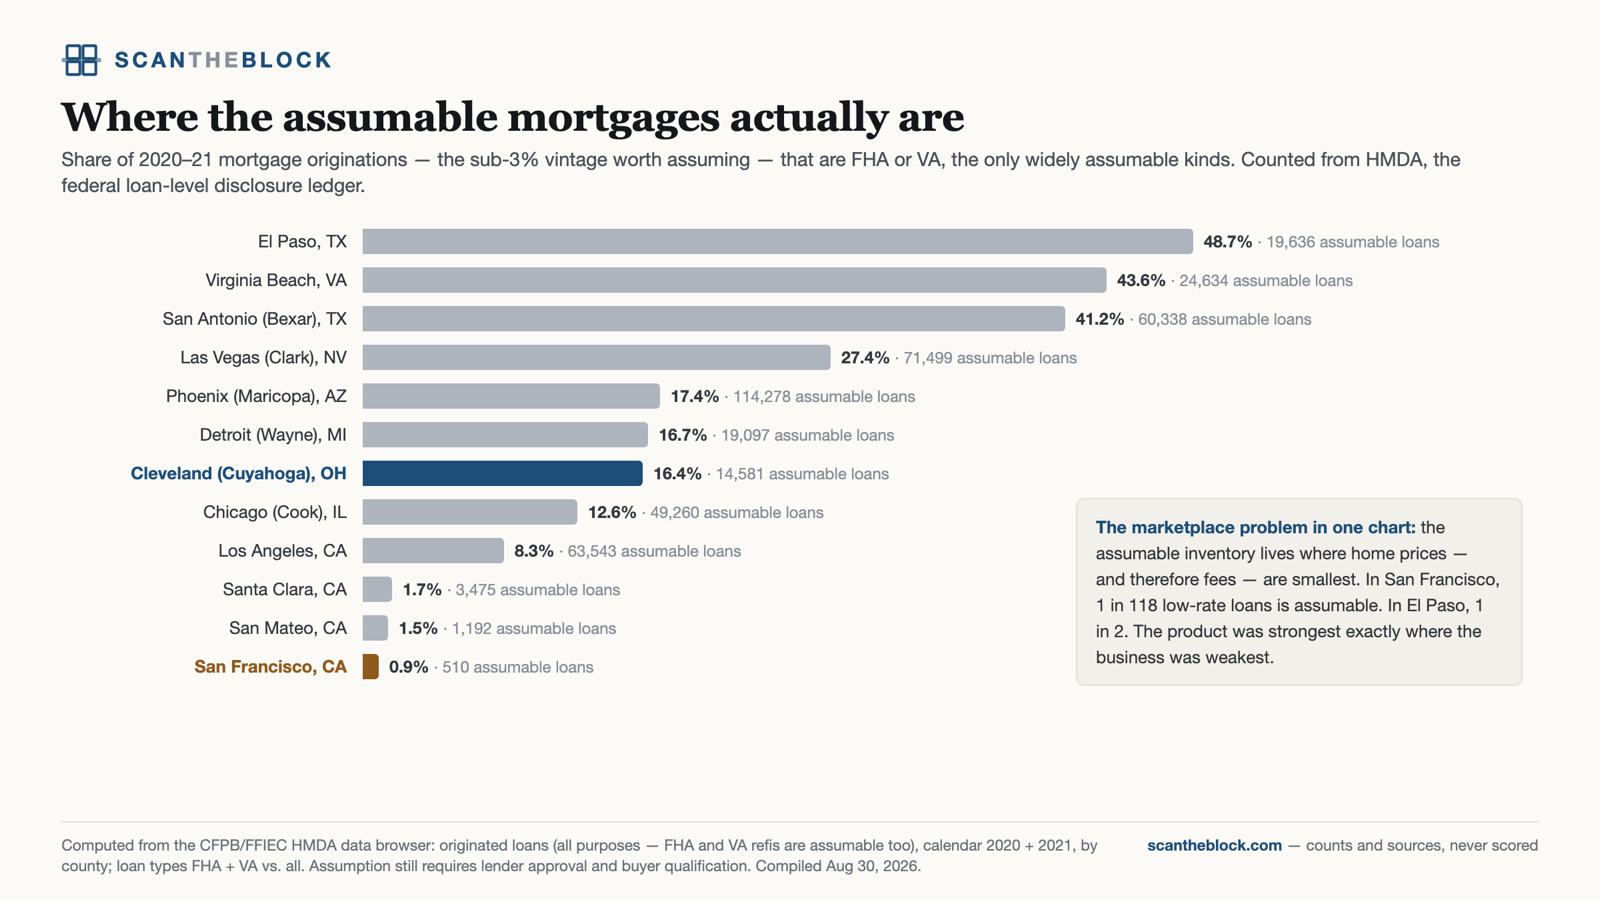
Share of 2020–21 mortgage originations — the sub-3% vintage worth assuming — that are FHA or VA, the only widely assumable kinds, across twelve illustrative counties. San Francisco: 0.9% (510 loans). El Paso: 48.7%. The assumable inventory concentrates in military towns and low-price metros — exactly where a marketplace's per-transaction fee is smallest.
Method. CFPB/FFIEC HMDA data browser: originated loans of all purposes (FHA and VA refinances are assumable too), calendar 2020 plus 2021, by county; FHA + VA counts against all originations. Assumption still requires lender approval and buyer qualification.
2026-08-30
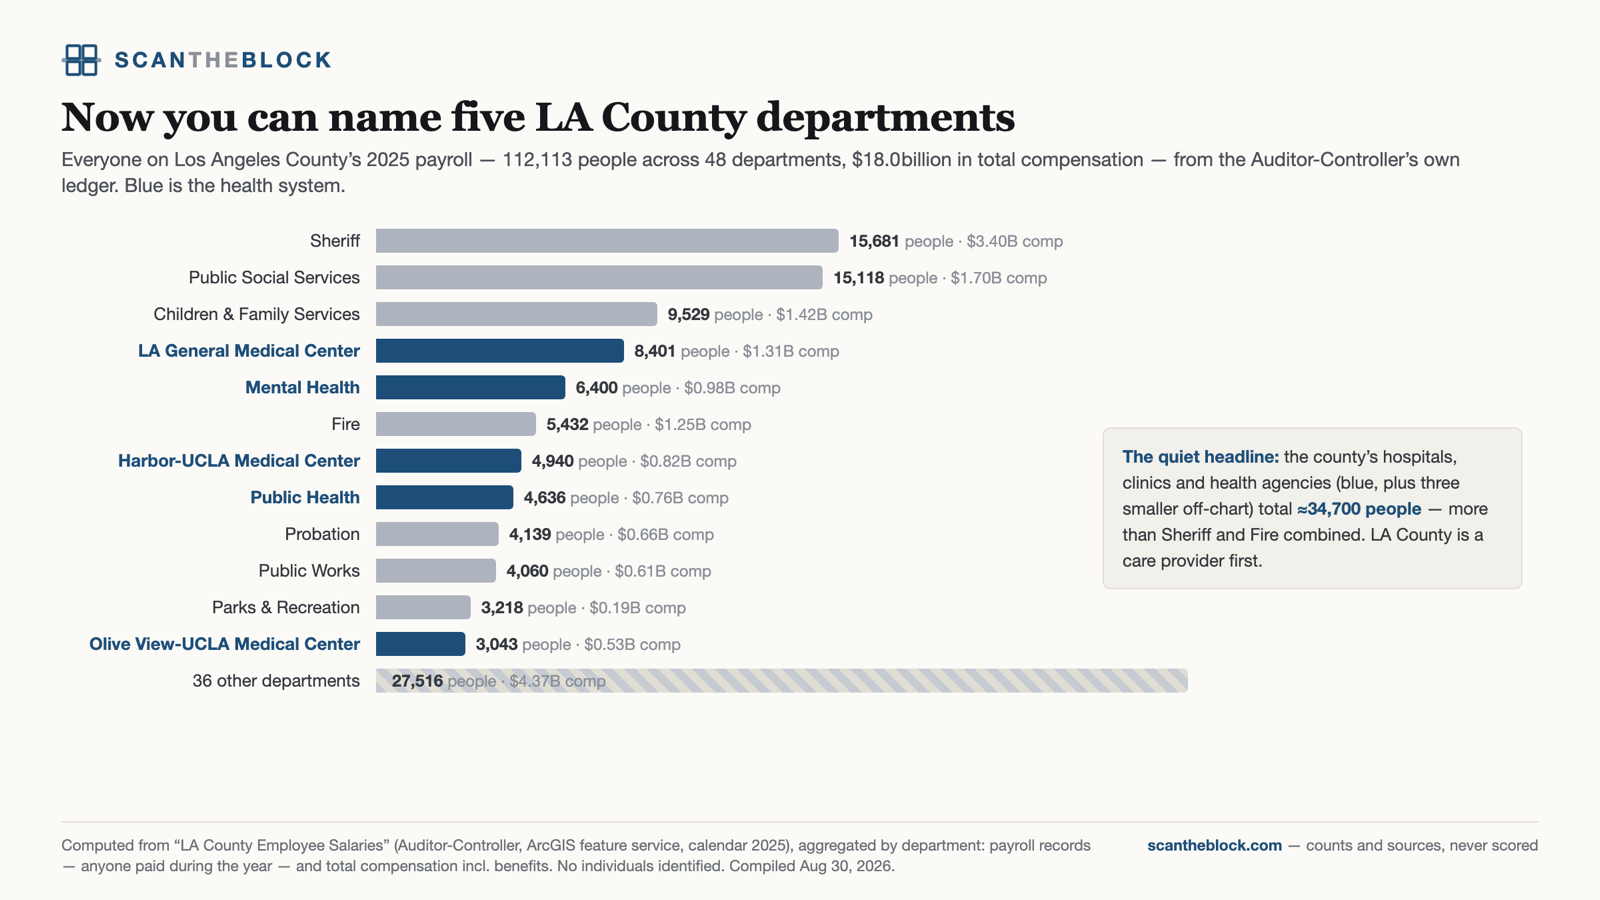
Everyone on Los Angeles County's 2025 payroll — 112,113 people across 48 departments, $18.0 billion in total compensation — sized by department. The quiet headline: the county's hospitals, clinics and health agencies together employ roughly 34,700 people, more than the Sheriff and Fire combined. LA County is a care provider first.
Method. LA County Auditor-Controller employee salary data (public ArcGIS feature service), calendar 2025, aggregated by department: payroll records — anyone paid during the year, which runs above point-in-time headcount — and total compensation including benefits. No individuals identified.
2026-08-30
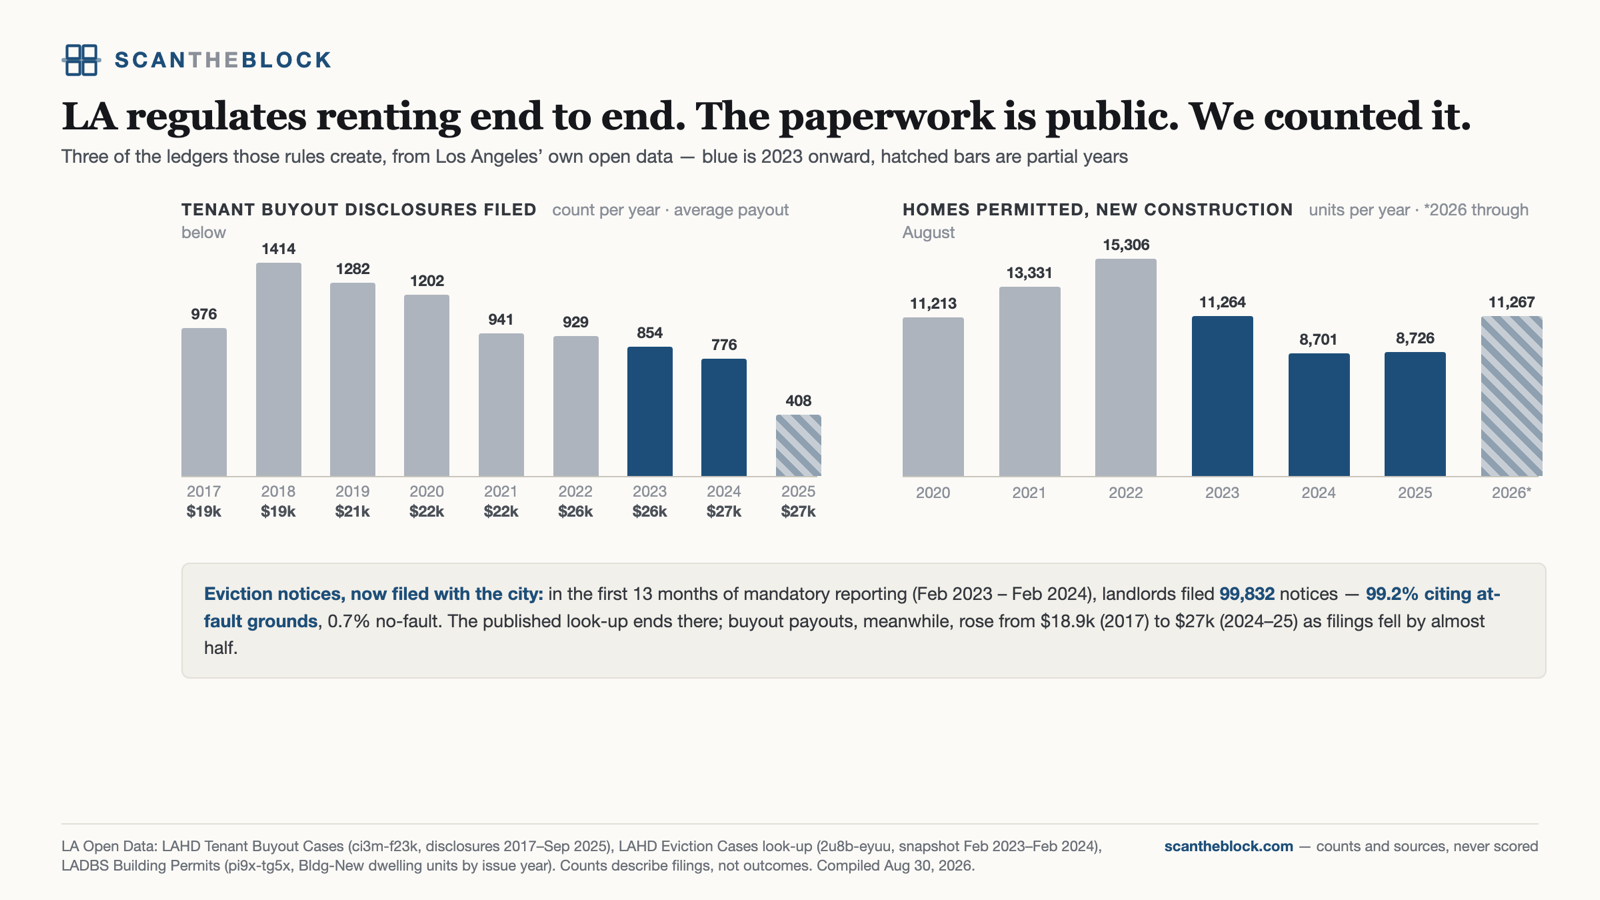
Three of the ledgers Los Angeles' rental rules create. Tenant buyout disclosures: filings fell by almost half since 2018 while the average payout rose from $18.9k to $27k. Eviction notices: 99,832 filed in the first 13 months of mandatory reporting, 99.2% citing at-fault grounds. New construction: units permitted slid from 15,306 (2022) to about 8,700 (2024–25) — and 2026 through August already exceeds both full prior years.
Method. LA Open Data: LAHD Tenant Buyout Cases (disclosures 2017–Sep 2025), LAHD Eviction Cases look-up (a snapshot covering Feb 2023–Feb 2024), and LADBS building permits (new-construction dwelling units by issue year). Counts describe filings, not outcomes.
2026-08-30
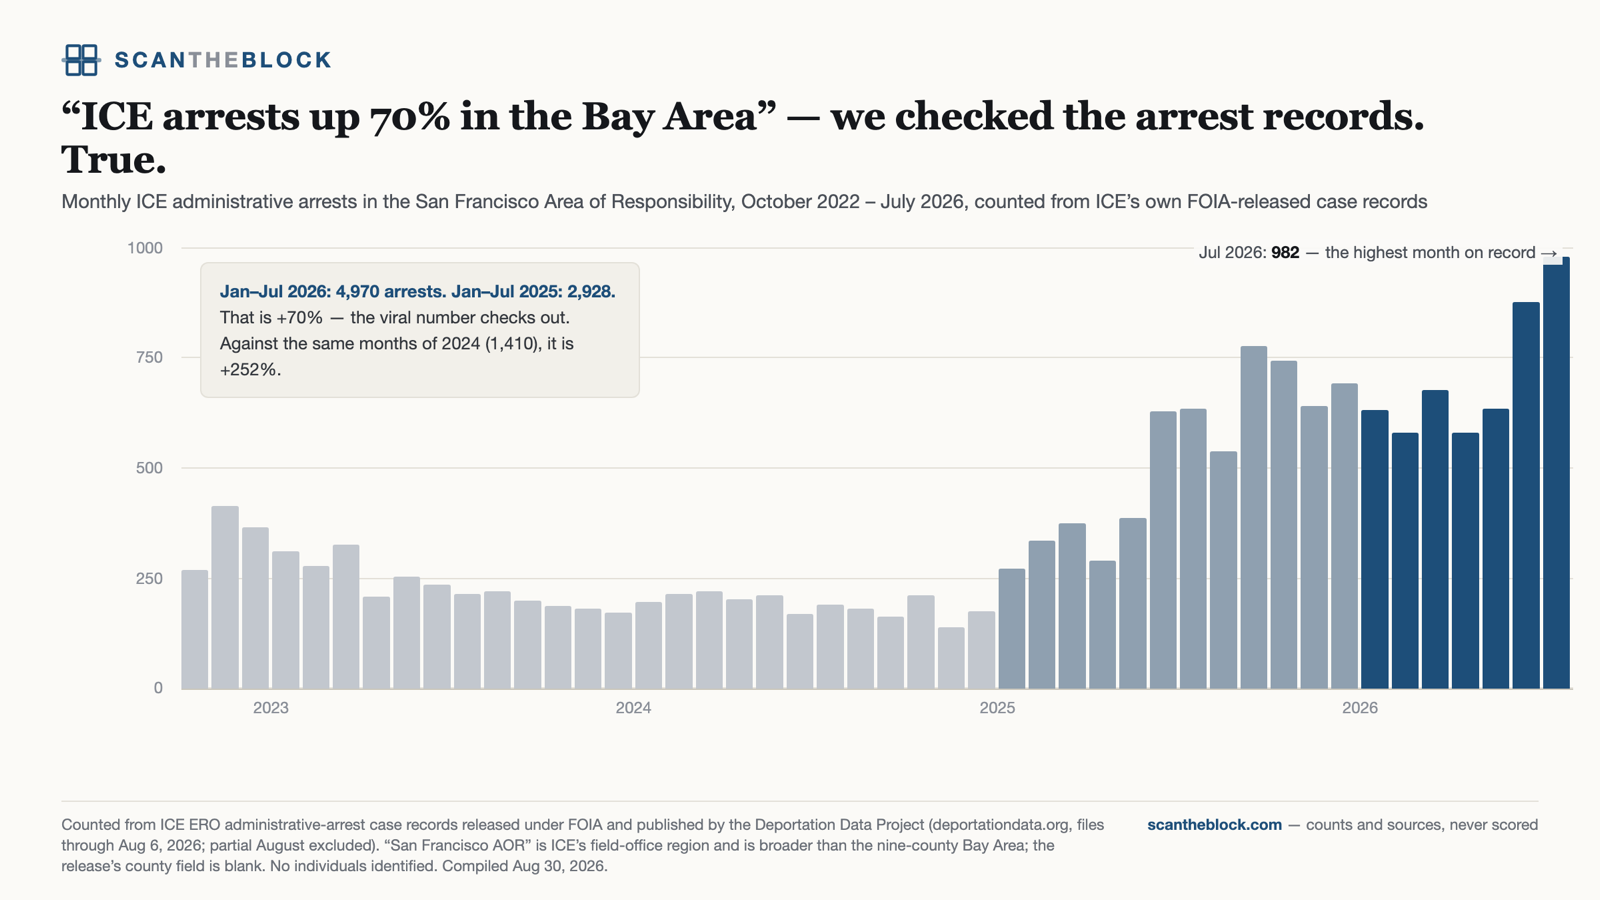
Monthly ICE administrative arrests in the San Francisco Area of Responsibility, October 2022 – July 2026, counted from ICE's own FOIA-released case records. January–July 2026: 4,970 arrests against 2,928 a year earlier — +70%, confirming the viral figure. July 2026 (982) is the highest month in the record.
Method. ICE ERO administrative-arrest case records released under FOIA and published by the Deportation Data Project, files through Aug 6, 2026; the partial August is excluded. The San Francisco AOR is ICE's field-office region and is broader than the nine-county Bay Area; the release's county field is blank. Monthly counts only — no individuals identified.
2026-08-30
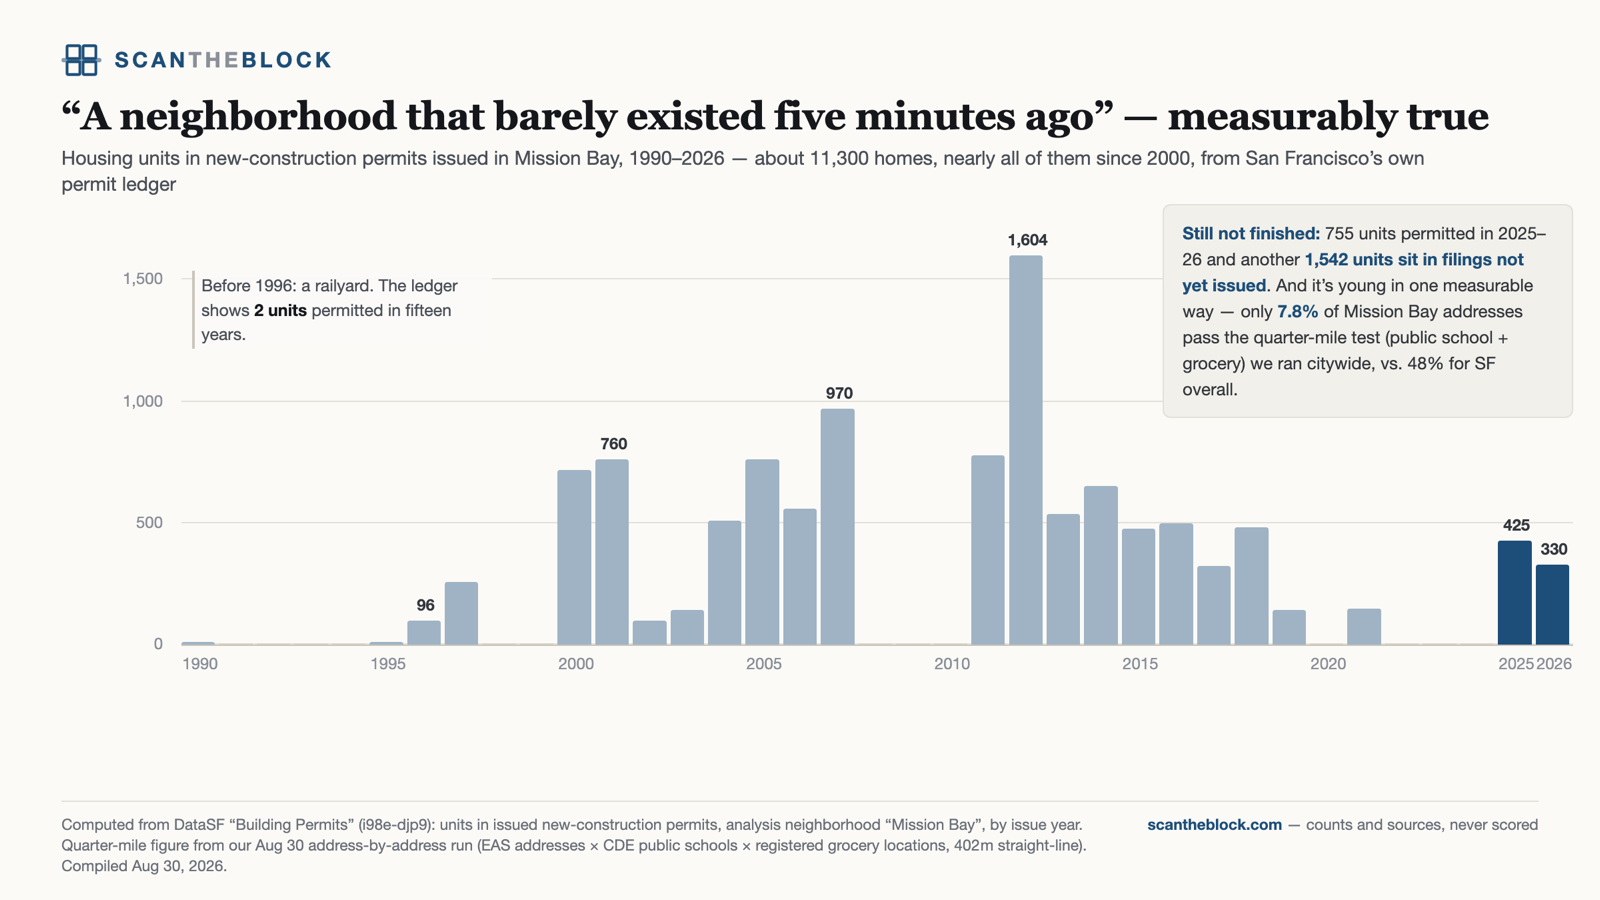
Housing units in new-construction permits issued in Mission Bay, 1990–2026. Before 1996 the ledger shows two units in fifteen years — it was a railyard. Since then: roughly 11,300 homes, with 755 more permitted in 2025–26 and 1,542 units sitting in filings not yet issued. One measure of its youth: only 7.8% of Mission Bay addresses pass the quarter-mile test we ran citywide, against 48% for San Francisco overall.
Method. DataSF building permits: units in issued new-construction permits, analysis neighborhood “Mission Bay”, by issue year. The quarter-mile figure comes from our address-by-address run of Aug 30, 2026 (see “The quarter-mile test” below).
2026-08-30
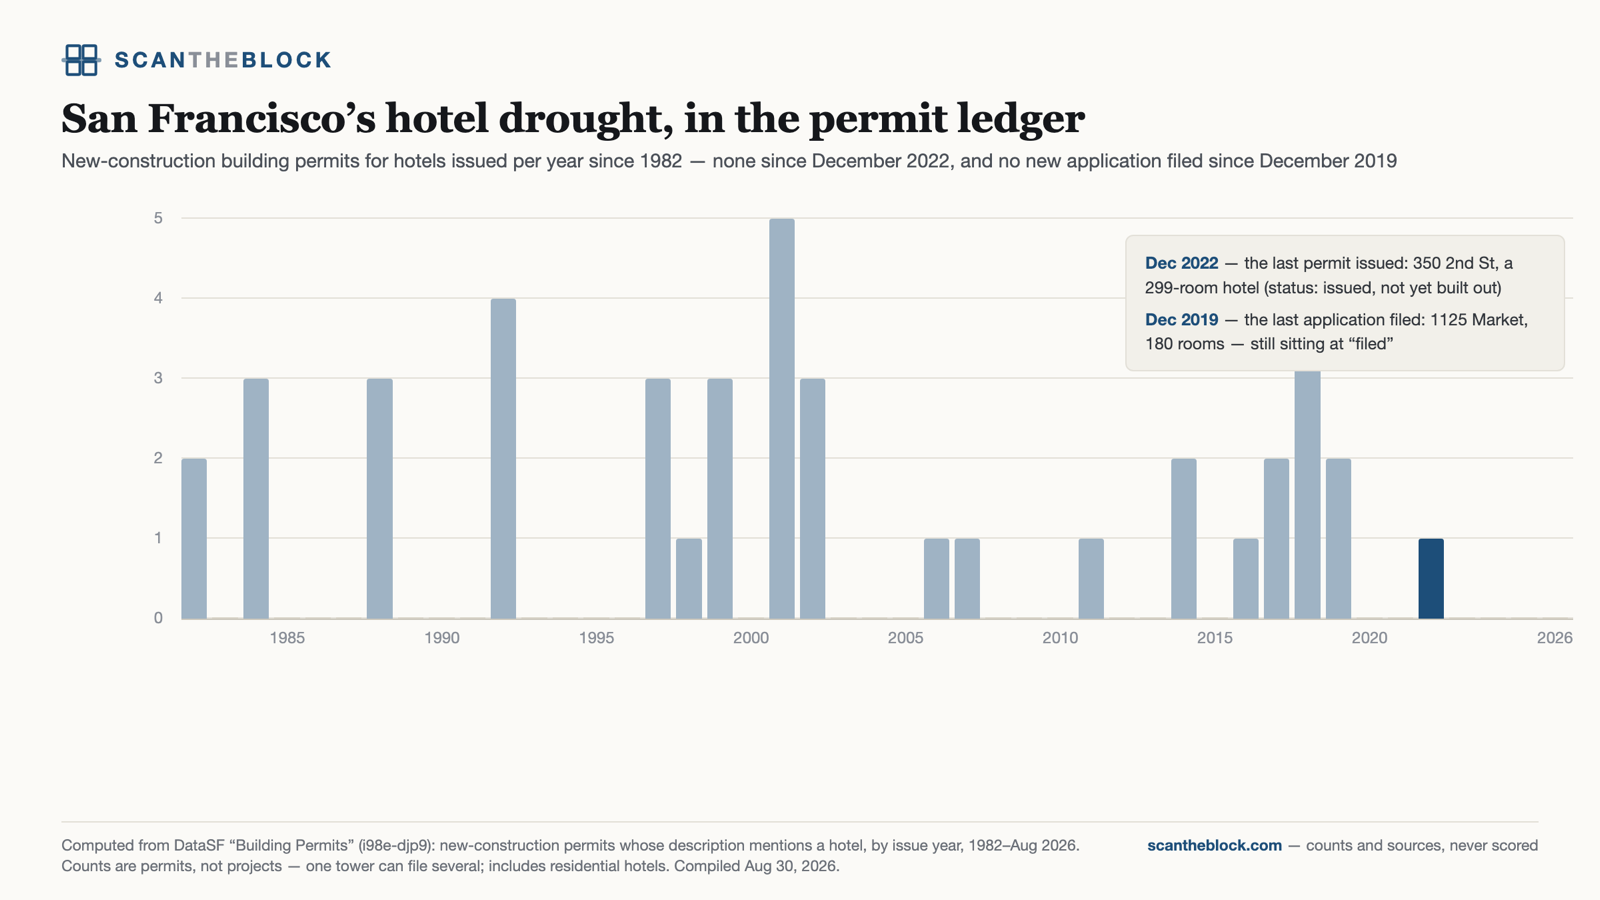
New-construction building permits for hotels issued per year since 1982. The last permit issued was December 2022 — a 299-room project at 350 2nd St that still isn't built out — and the last new application was filed in December 2019. Nearly seven years since anyone asked to build a hotel here.
Method. DataSF building permits: new-construction permits whose description mentions a hotel, by issue year, 1982–Aug 2026. Counts are permits, not projects — one tower can file several — and include residential hotels. The two headline dates are about absence, so they are robust to the matching caveat.
2026-08-30
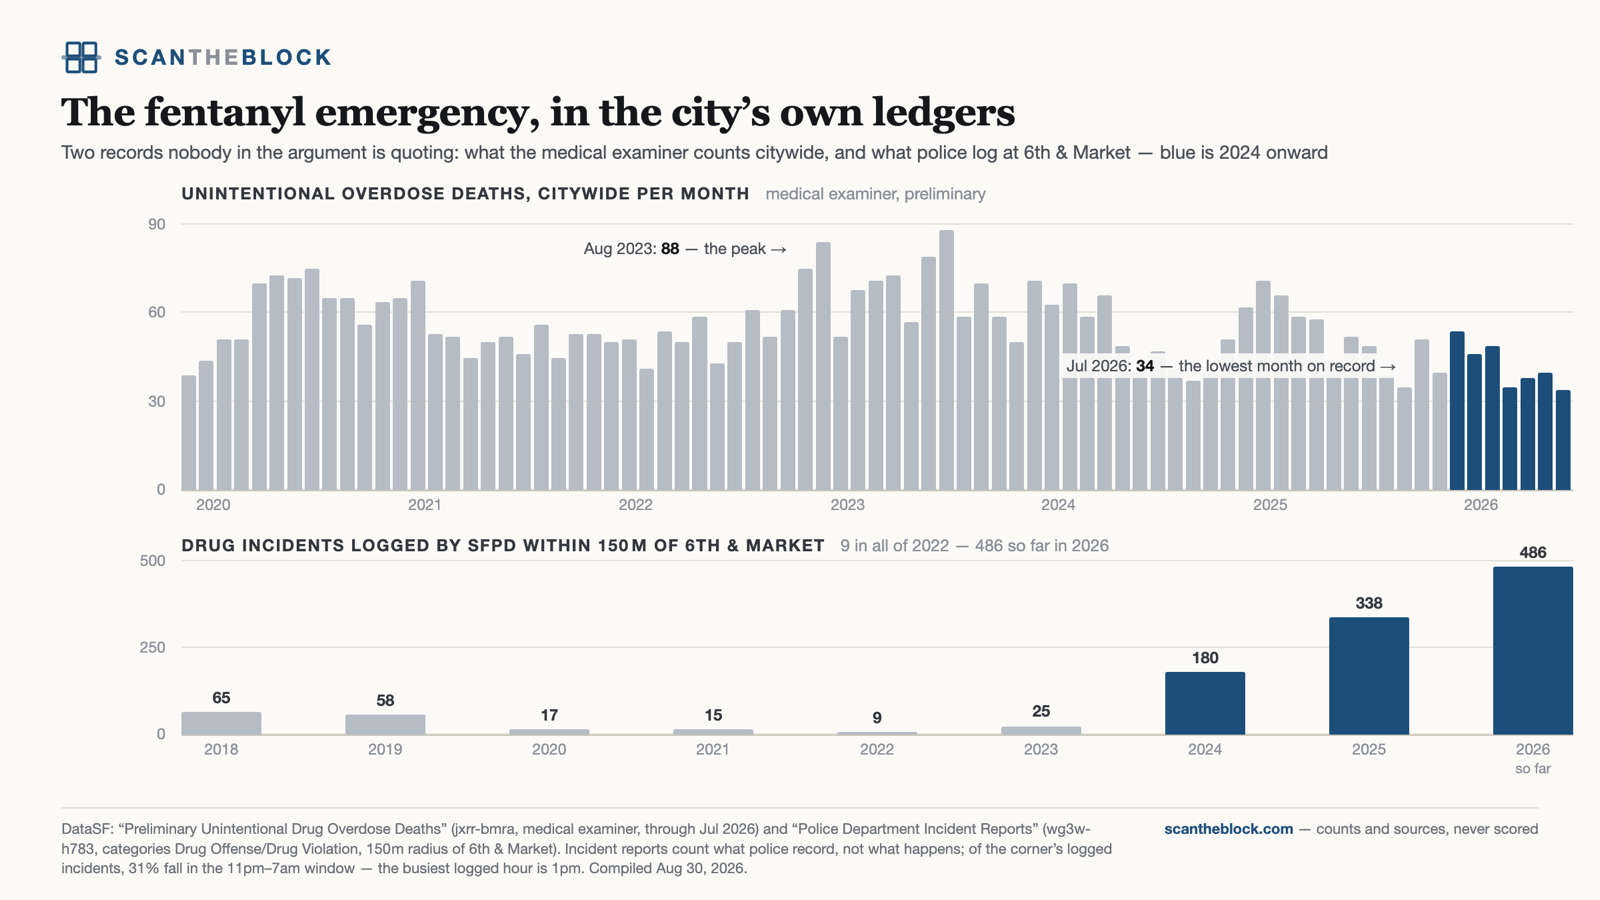
Two records the argument never quotes. The medical examiner's count: overdose deaths peaked at 88 a month in August 2023; July 2026 was 34, the lowest month in the record. SFPD's own log at 6th & Market: 9 drug incidents in all of 2022, 486 in 2026 through August — a fifty-fold rise in enforcement at one corner.
Method. DataSF: preliminary unintentional drug-overdose deaths (medical examiner, monthly, through July 2026) and police incident reports (drug categories, within 150 m of 6th & Market). Incident reports count what police record, not what happens; 31% of the corner's logged incidents fall in the 11pm–7am window, and the busiest logged hour is 1pm.
2026-08-30
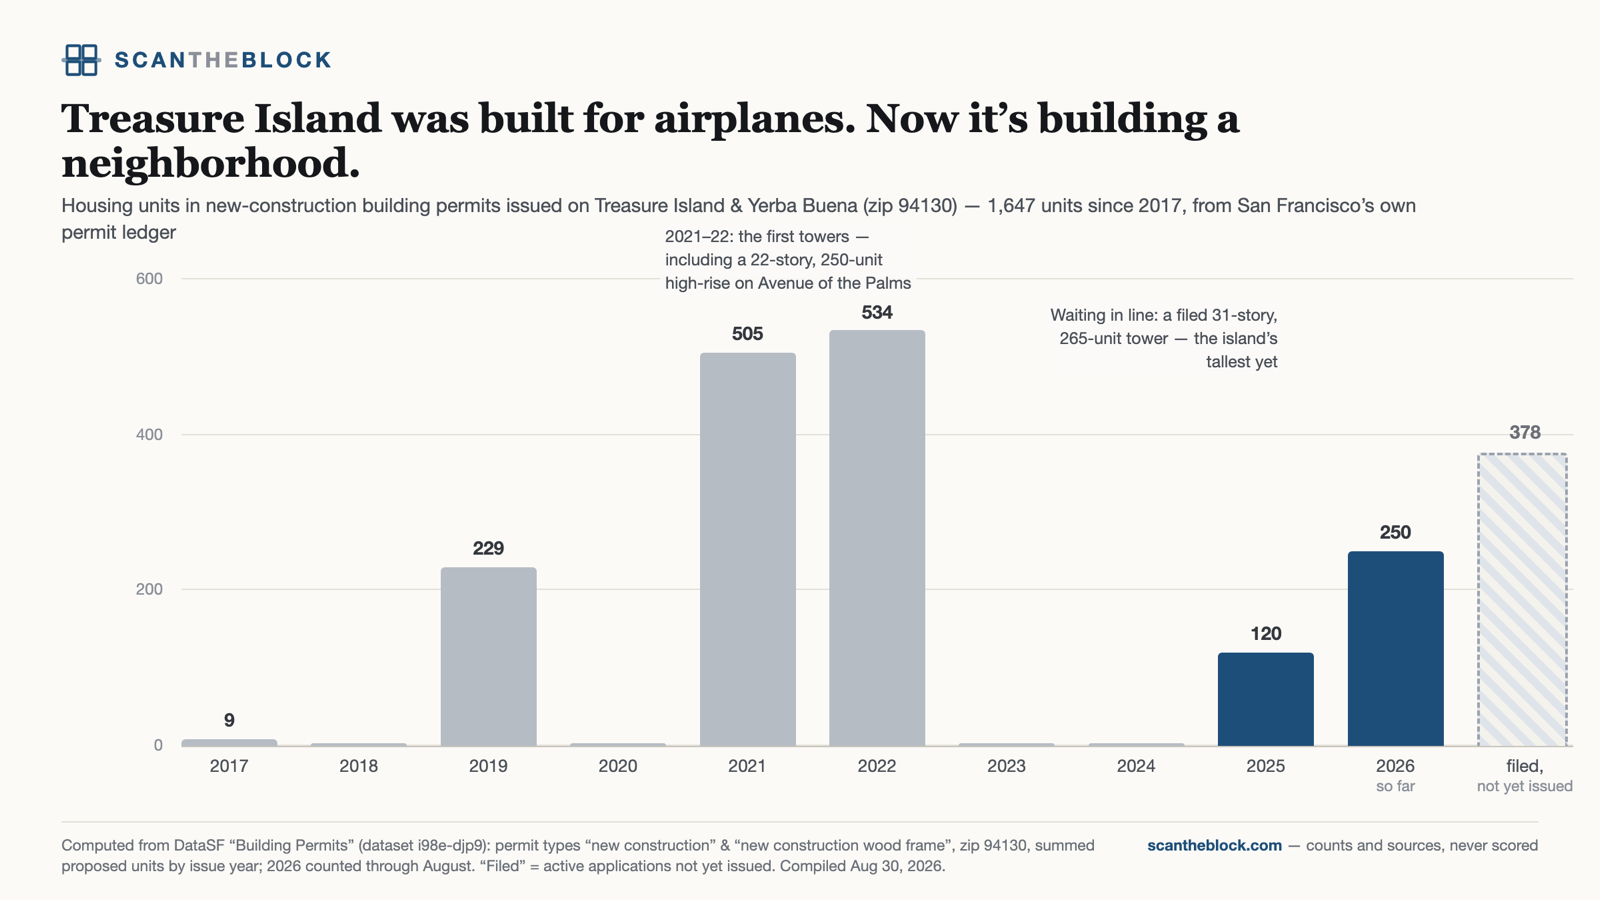
Housing units in new-construction permits issued on Treasure Island and Yerba Buena: 1,647 units since 2017, including 250 in 2026 through August, with 378 more units in active filings — among them a 31-story, 265-unit tower that would be the island's tallest.
Method. DataSF building permits: permit types “new construction” and “new construction wood frame”, zip 94130, proposed units summed by issue year; withdrawn filings excluded from the pending figure.
2026-08-30
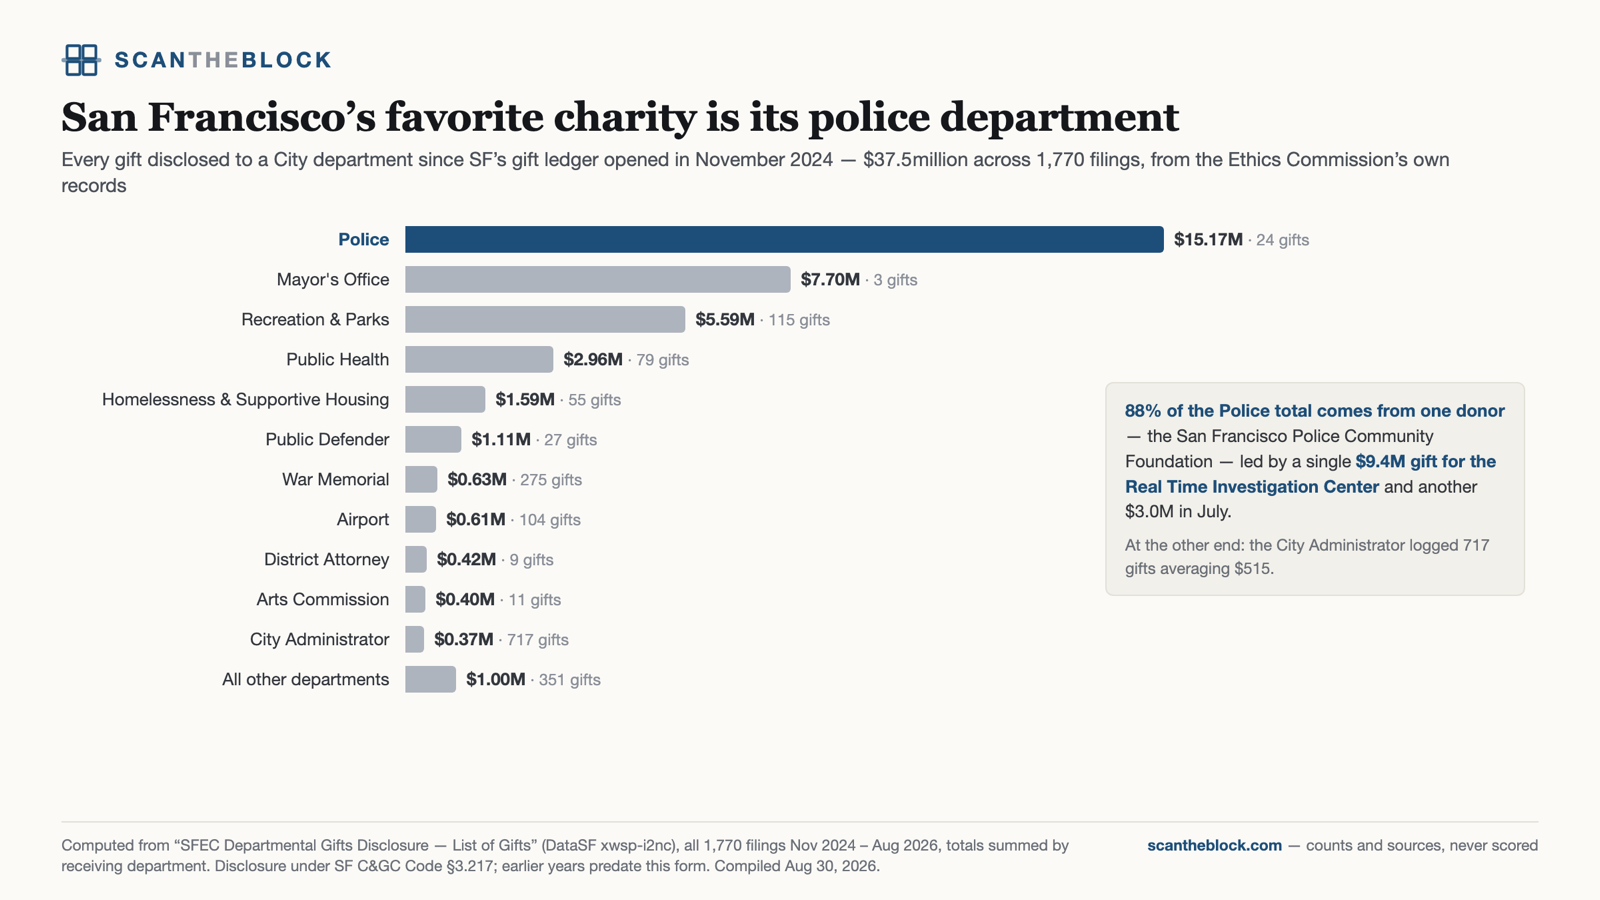
Every gift disclosed to a City department since San Francisco's gift ledger opened in November 2024: $37.5 million across 1,770 filings. The Police Department leads at $15.2M — 40% of everything — with 88% of that from a single donor, led by a $9.4M gift for the Real Time Investigation Center. At the other end, the City Administrator logged 717 gifts averaging $515.
Method. SFEC departmental gifts disclosure (Ethics Commission, DataSF), all filings Nov 2024 – Aug 2026, totals summed by receiving department. Disclosure under SF C&GC Code §3.217; earlier years predate the form. Organizational donors only are named.
2026-08-30
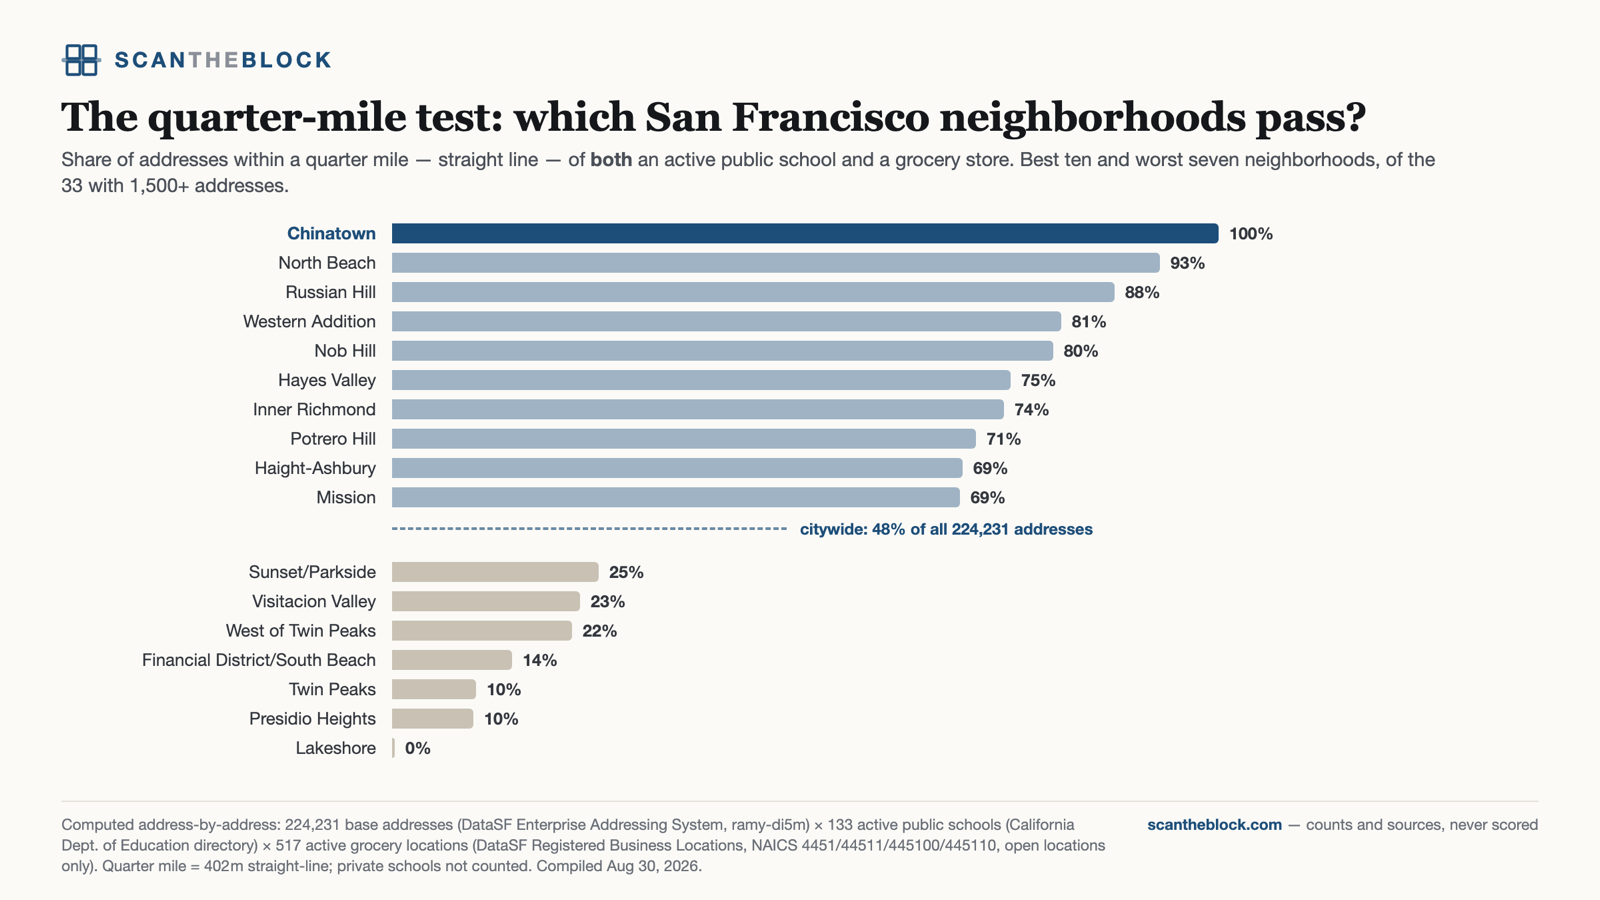
The share of addresses within a quarter mile of both an active public school and a grocery store, computed for every one of San Francisco's 224,231 base addresses. Citywide: 48%. Chinatown passes at 100%, North Beach at 93% — and Presidio Heights, some of the most expensive housing in the country, at 10%. Density buys the quarter-mile life; price doesn't.
Method. DataSF Enterprise Addressing System (224,231 base addresses) × the California Dept. of Education directory (133 active public schools) × DataSF registered business locations (517 open grocery locations under supermarket/grocery NAICS codes). Quarter mile = 402 m straight-line; private schools not counted.
2026-08-30
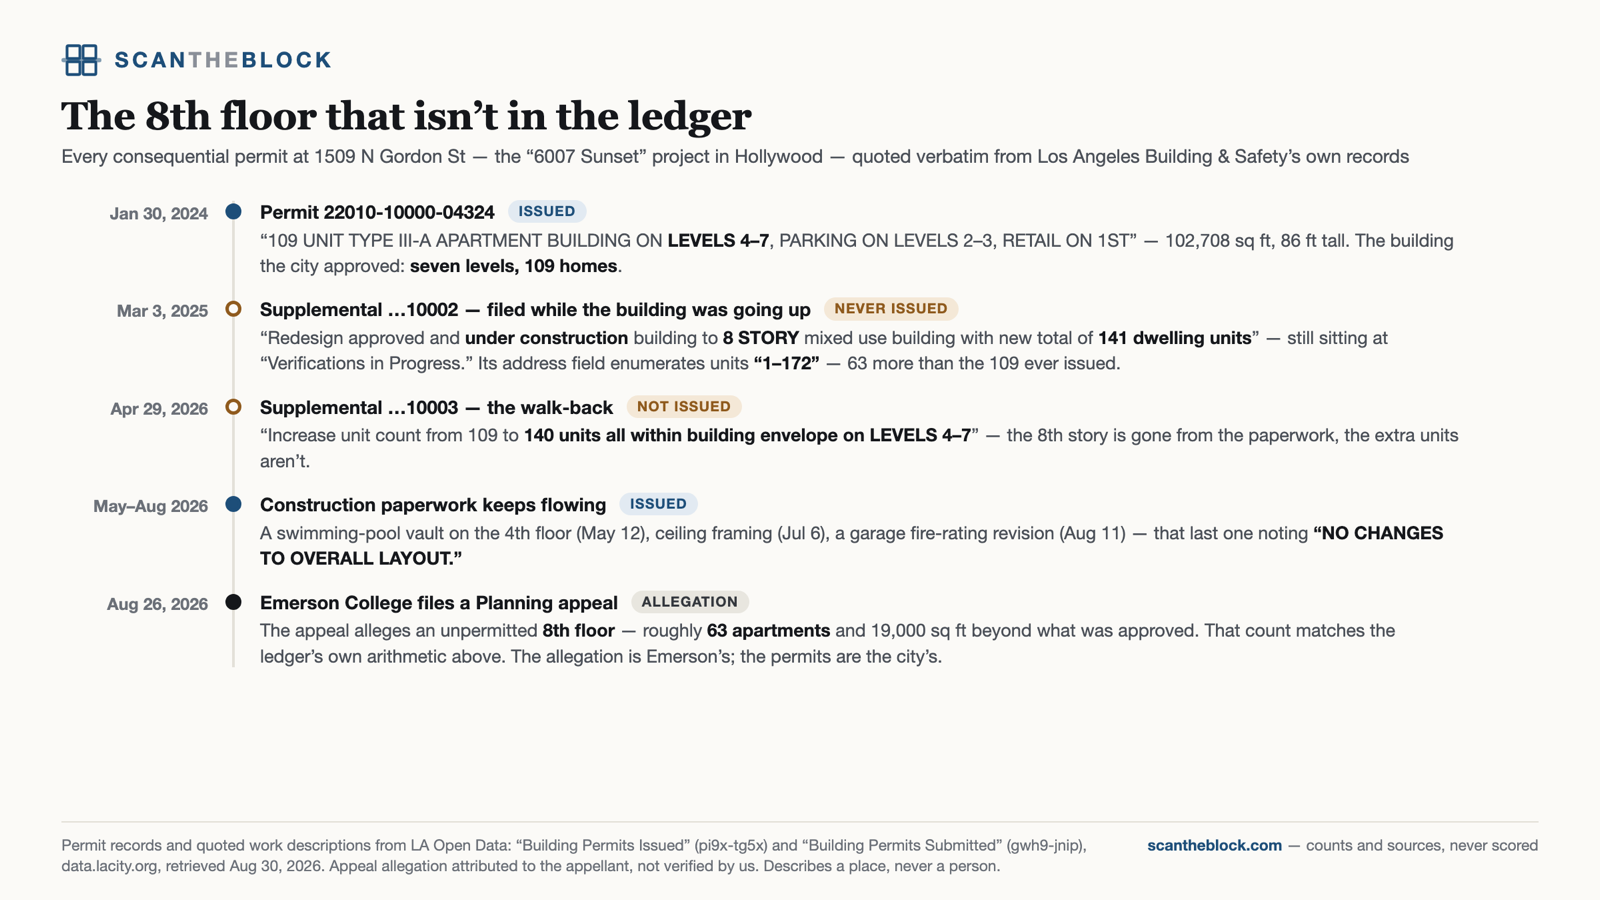
Every consequential permit at 1509 N Gordon St — the “6007 Sunset” project in Hollywood — quoted verbatim. The issued permit: 109 units on levels 4–7. A supplemental filed mid-construction to make it “8 STORY … 141 dwelling units” has never been issued, and its address field enumerates units “1–172” — 63 more than approved, matching the appeal's arithmetic. A later filing walks back to “140 units all within building envelope on levels 4–7.”
Method. LA Open Data: LADBS building permits issued and submitted, quoted from the permits' own work descriptions. The allegation that the extra floor was built is the appellant's, not verified by us. Describes a place, never a person.
2026-08-30
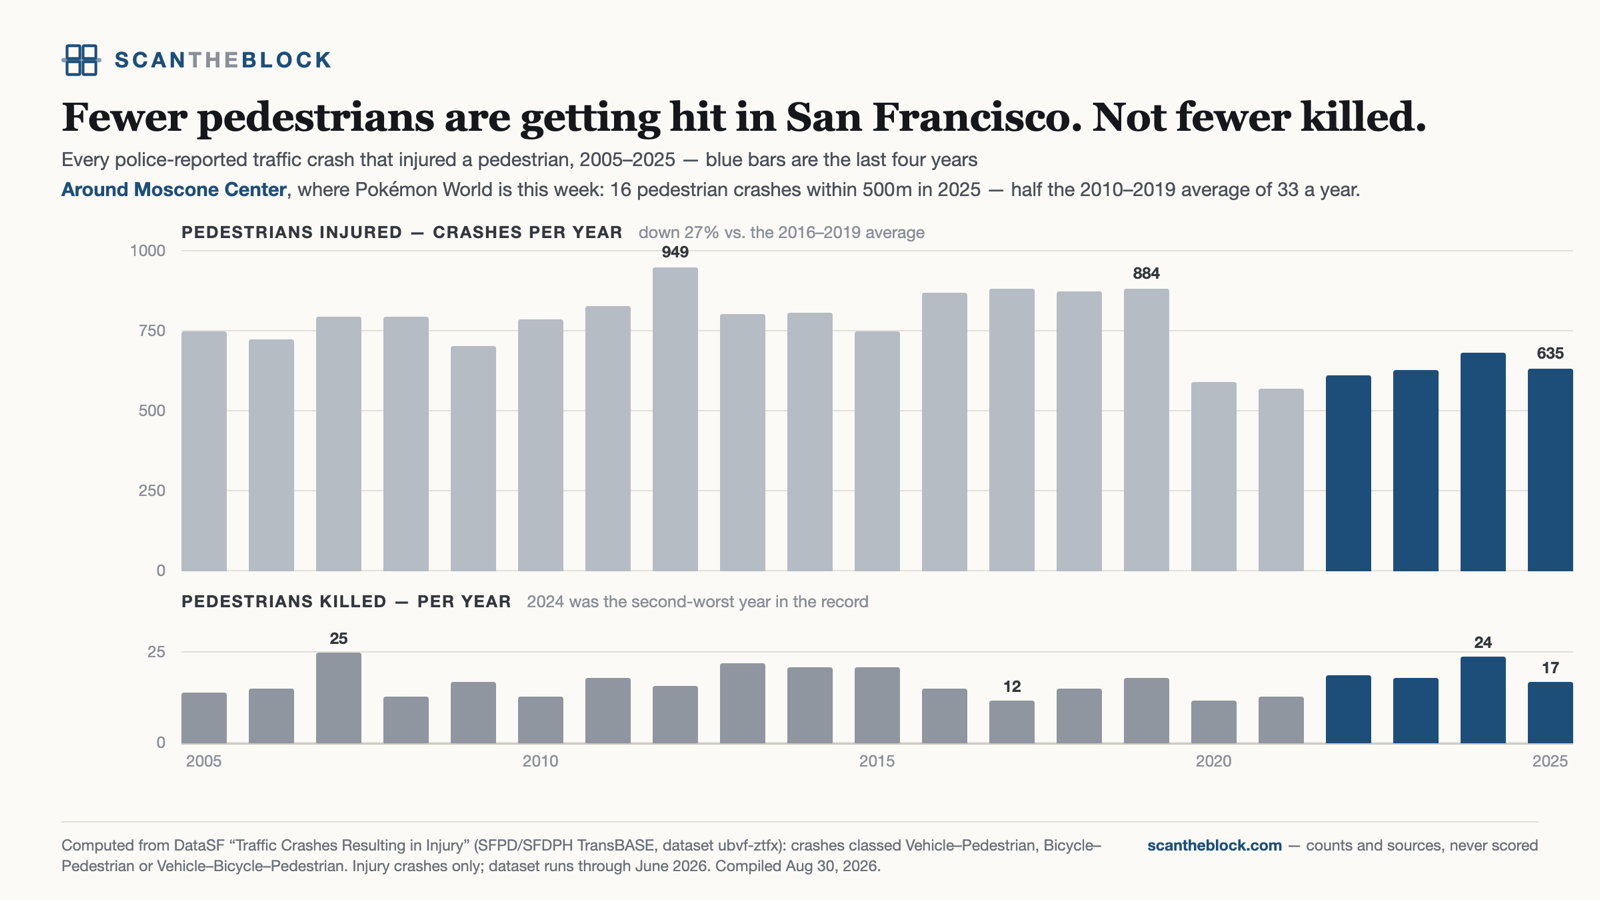
Every police-reported traffic crash that injured a pedestrian, 2005–2025. Injury crashes are down 27% against the 2016–2019 average — but 2024's 24 deaths made it the second-worst year in the record. Around Moscone Center, 2025 saw 16 pedestrian crashes, half the 2010s average.
Method. DataSF traffic crashes resulting in injury (SFPD/SFDPH TransBASE): crashes classed Vehicle–Pedestrian, Bicycle–Pedestrian or Vehicle–Bicycle–Pedestrian; injury crashes only; the Moscone figure uses a 500 m radius.
2026-08-30
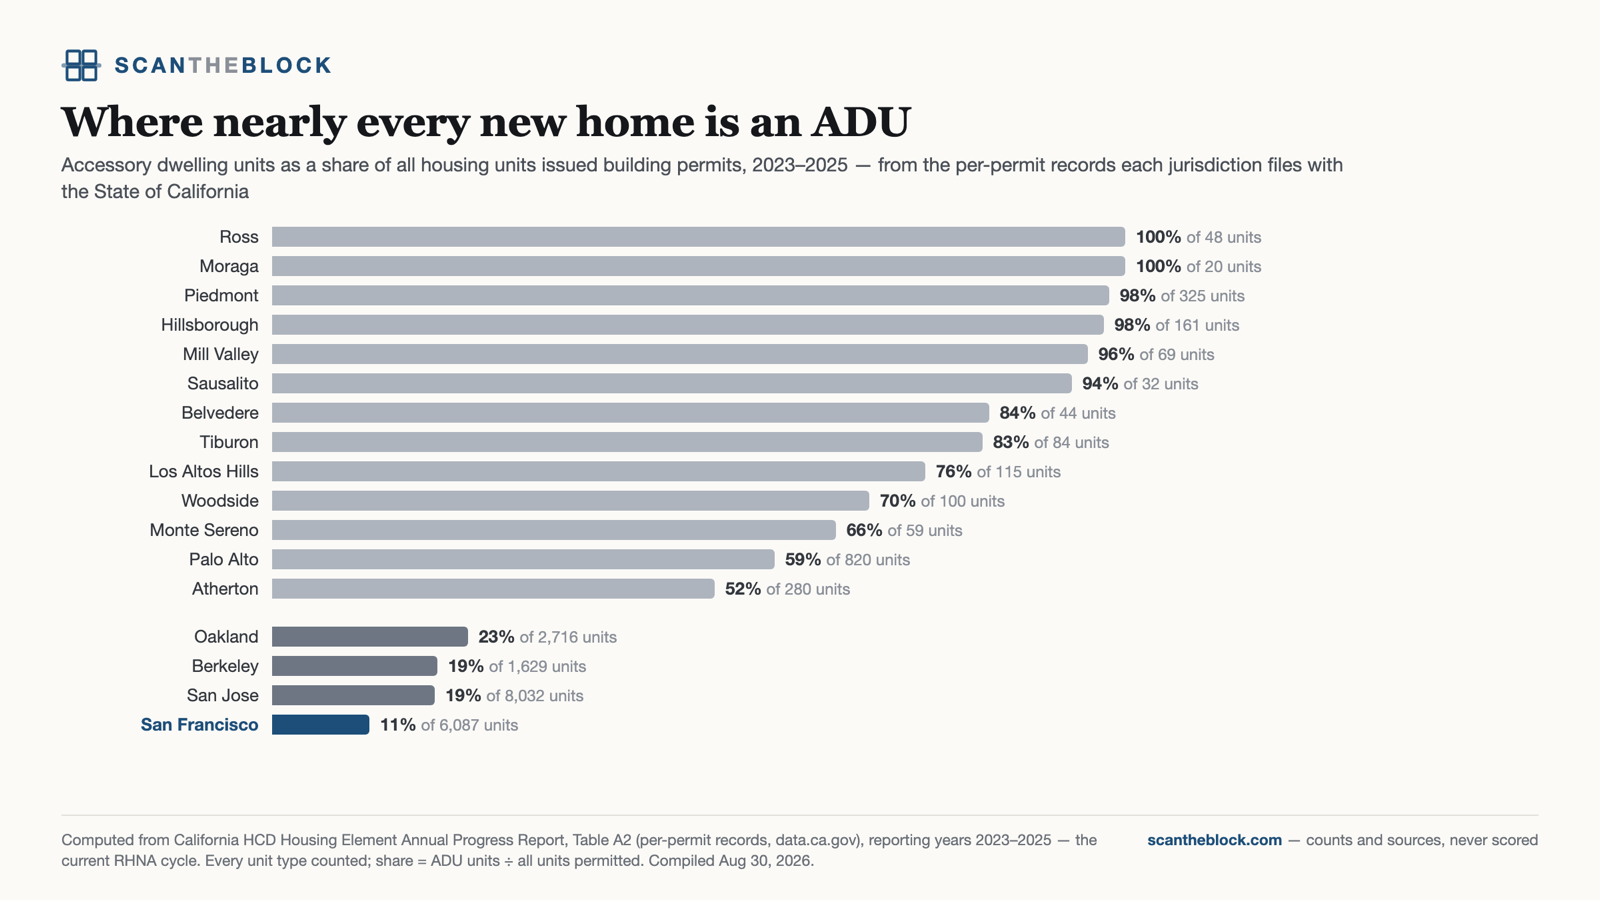
Accessory dwelling units as a share of all housing units issued building permits, 2023–2025, across Bay Area jurisdictions. Ross and Moraga: 100%. Piedmont: 98%. Hillsborough: 98% — confirming the reported figure. San Francisco, for contrast: 11% of 6,087 units.
Method. California HCD Housing Element Annual Progress Report, Table A2 — the per-permit records each jurisdiction files with the state — reporting years 2023–2025, every unit type counted; share = ADU units ÷ all units permitted.
2026-08-30
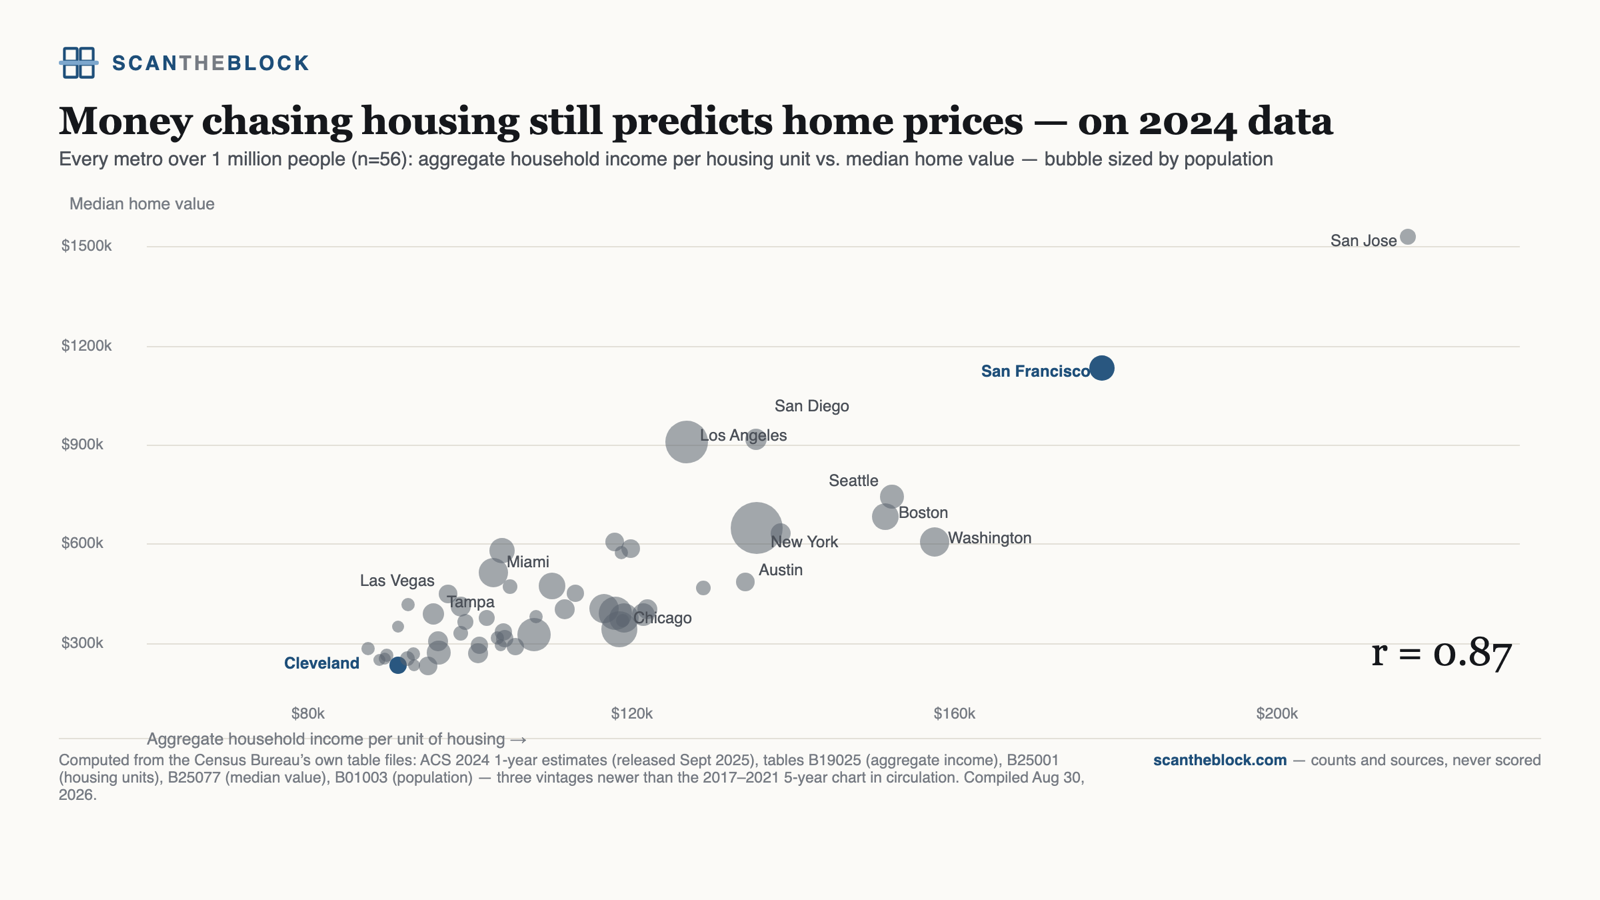
Every metro over 1 million people (n = 56): aggregate household income per housing unit against median home value, bubbles sized by population. The relationship holds at r = 0.87 on the Census Bureau's newest release — three vintages fresher than the 2017–2021 chart in circulation.
Method. ACS 2024 1-year estimates (released Sept 2025), tables B19025 (aggregate income), B25001 (housing units), B25077 (median value), B01003 (population), from the Census Bureau's own table files. 1-year estimates exist only for larger geographies, hence n = 56.
2026-08-30
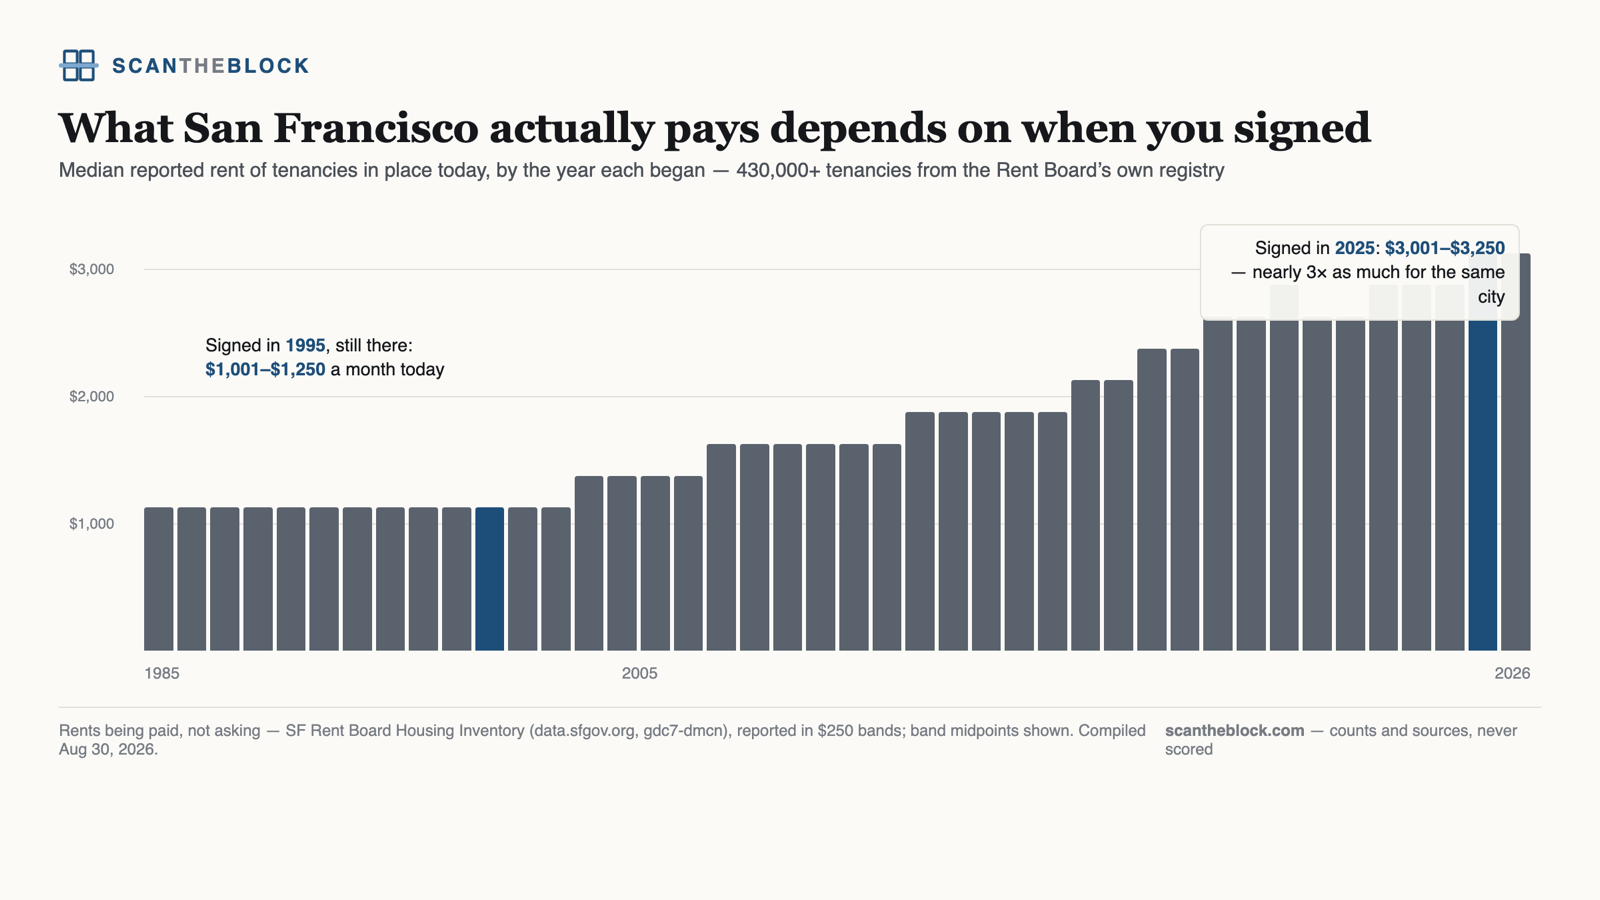
The median reported rent band by tenancy-start year, 1985–2026, from the Rent Board's housing-inventory filings: from the $1,001–$1,250 band for tenancies begun in 1995 to $3,001–$3,250 for 2025.
Method. SF Rent Board Housing Inventory (DataSF): unit counts by monthly-rent band and tenancy-start year; medians computed from the full band-by-year distribution. Rents are reported in $250 bands, so values are band midpoints, not exact dollars.